One thing any academic does (except those at grand institutions where they get to have someone else do it for them) is evaluate students through grading. Most institutions afford students the opportunity to retaliate through the faculty evaluation system in place. That usually takes places at the end of the term, although my institution now had mid-term evaluations in place.
Student evaluations of faculty always take me back to this incident in my own undergraduate saga:
One of the things that the Mechanical Engineering department required* its majors to take was Logic, which was offered by the Philosophy Department. Most of the engineers did pretty well in this course, which was doubtless a source of secret frustration to liberal arts’ professors.
One day I went up to pick up a test from the professor. The professor looked at the grade, noted that I had nearly aced it, looked at me, and exclaimed, “You’re not as dumb as you look!”
The purpose of student evaluations of me is to determine whether they agree with my Logic teacher’s opinion or not.
*Originally posted here. Since then I discovered that there was another option available, but my advisor at the time did not avail me of that choice.
The impulse–response (IR) test is the most commonly used field procedure for assessing the structural integrity of piles embedded in soil. The IR test uses the response of the pile to waves induced by an impulse load applied at the pile head in order to assess the condition of the pile. However, due to the contact between the pile and the soil, the recorded response at the pile head carries information not only about the pile, but about the soil as well, thus creating the as-yet-unexplored opportunity to characterize the properties of the surrounding soil. In effect, such dual use of the IR test data renders piles into probes for characterizing the near-surface soil deposits and/or soil erosion along the pile–soil interface. In this article, we discuss a systematic full-waveform-based inversion methodology that allows imaging of the soil surrounding a pile using conventional IR test data. We adopt a heterogeneous Winkler model to account for the effect of the soil on the pile’s response, and the pile’s end is assumed to be elastically supported, thus also accounting for the underlying soil. We appeal to a partial differential equation (PDE)-constrained-optimization approach, where we seek to minimize the misfit between the recorded time-domain response at the pile head (the IR data), and the response due to trial distributions of the spatially varying soil stiffness, subject to the coupled pile–soil wave propagation physics. We report numerical experiments involving layered soil profiles for piles founded on either soft or stiff soil, where the inversion methodology successfully characterizes the soil.
Over the years I have been looking at many different aspects of the problem of pile dynamics, which includes both prediction of drivability of piles and the inverse problem of estimating the static resistance of piles based on their performance during driving. In the course of working with all of this many ideas have come to mind; two of those are as follows:
Is it possible to use the pile hammer as a geotechnical sounding tool to determine the properties of soil layers into which the pile is being driven? In Improved Methods for Forward and Inverse Solution of the Wave Equation for Piles the soil at any given point was defined by the “Mohr-Coulomb triple” (unit weight, internal friction angle and cohesion) along with other properties, which is the point for most soil testing. The inverse method returned those properties.
The present paper does some interesting things to get to those solutions but ultimately doesn’t quite get to reaching a solution to these problems.
The Strong Point
Probably the strongest point of the paper is the entire mathematical presentation, from the development of the method to its execution. It shows computational proficiency of a high order. For example, it is the first time in pile dynamics that I have seen the use of the conjugate gradient technique. As the product of a PhD program with a heavy emphasis on computational fluid mechanics, this technique was well familiar to me (along with GMRES, which was the method of choice for my colleagues.) One of the challenges the geotechnical industry faces moving forward is the proper application of numerical techniques to geotechnical problems which are non-linear in ways which are unknown in other fields. We have people who are specialists with the geomechanics and people who are specialists in numerical methods, but few are those who are proficient in both.
One thing I would like to mention is that my use of a polytope method–which had many drawbacks–was driven by the difficulties in optimising geotechnical problems. Those difficulties are caused largely by the existence of false minima and maxima in the solution. It is why we still see, for example, grid optimisation used for slope stability problems: the use of, say a Newton’s Method type of optimisation may easily result in finding a false minimum. Although I think the author’s techniques have great promise of solving these problems, it is something they will have to watch for moving forward.
The Soil Property Issue
Probably the greatest weakness of the paper is the way soil properties are characterised.
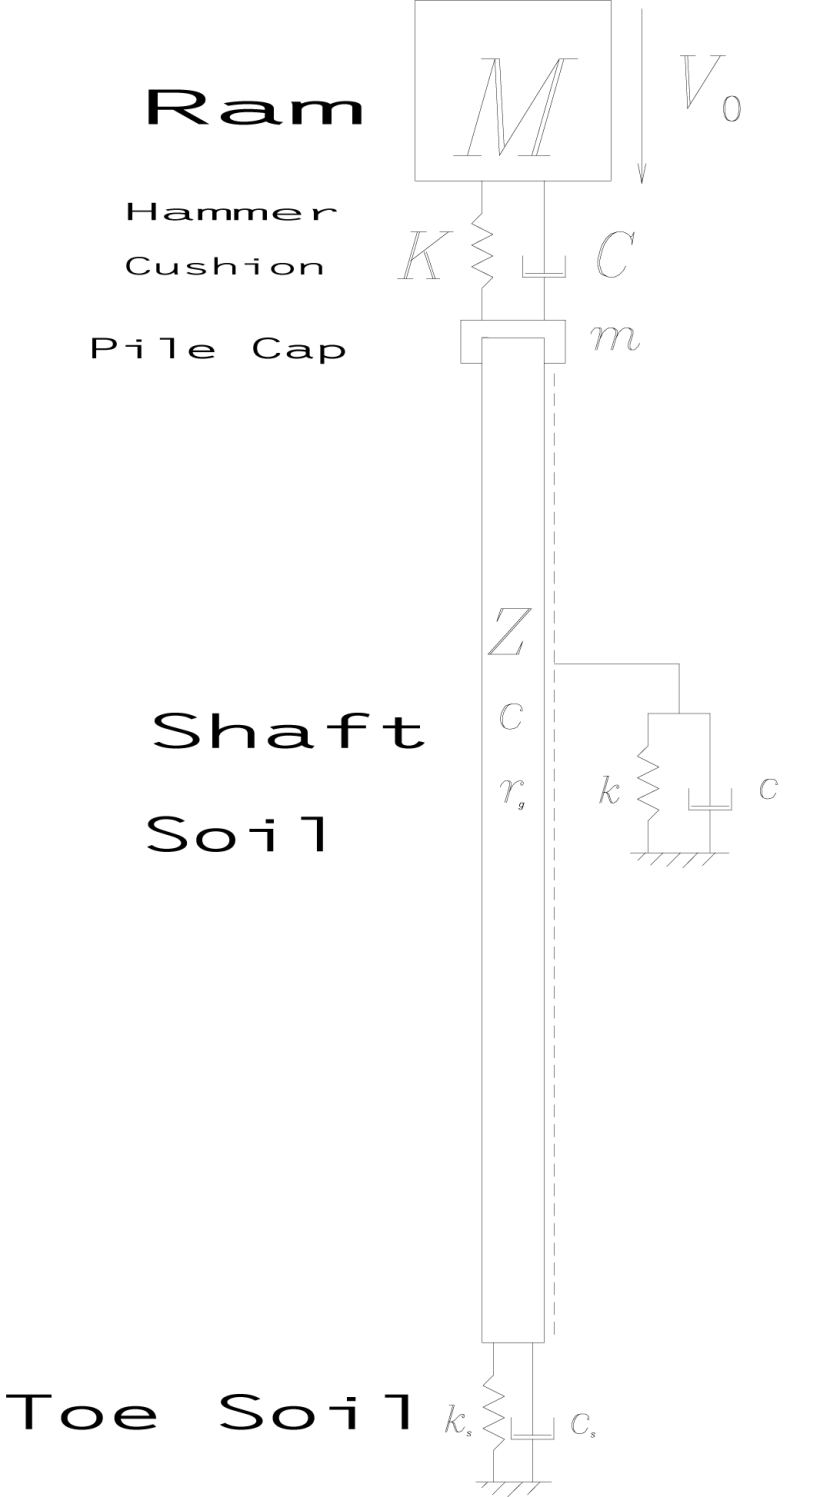
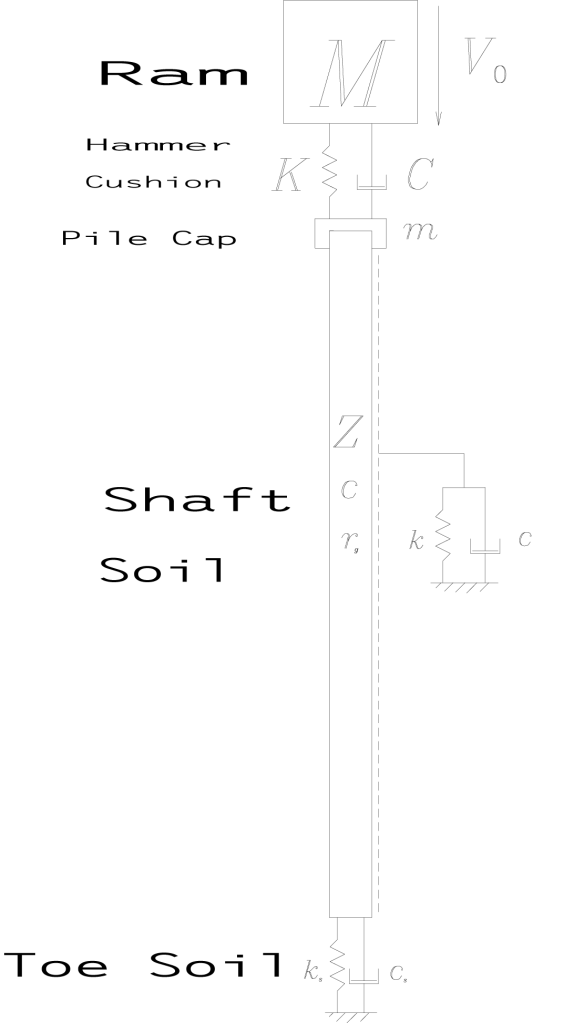
Simplified Hammer-Pile-Soil System (from Warrington (1997))
In this diagram the ram mass M impacts the cushion with a velocity Vo. There are several stiffnesses and damping coefficients k and c respectively. The accessory has a mass of m. The pile has an acoustic speed c, an impedance Z and a geometry ratio rg. For inverse analysis the hammer, cushion and driving accessory can be deleted and a force F(t) and velocity V(t) (both a function of time) substituted at the pile head.
The equation of motion u(x,t), which is a function of both the distance from the pile head x and time t, is given by the equation
(1)
The variables a and b are stiffness and damping related coefficients which are related to k and c by geometric and material property considerations, as discussed in Closed Form Solution of the Wave Equation for Piles.
Although the present paper allows for k(x), the one major difference between the governing equation presented above and the one in the paper is the omission of damping by the latter. (This omission is also repeated at the pile toe.) The soil damping is for the most part a representation of the propagation of wave energy from the pile as it is dynamically loaded. It is impossible to avoid in one form or another. First derivatives like that are always a danger in problems such as this. One way to get around that is to redistribute the damping into the spring and mass terms using Rayleigh damping. This is very frequency dependent and can be tricky to accurately apply; however, if it can be done successfully (and the authors’ note of wavespeed changes with soil interaction may be part of the solution) it would bypass the problems created by the first derivative. (The same comments regarding the shaft also apply at the toe, where an additional mass would have to be applied to achieve Rayleigh damping.)
But that doesn’t address what is, in some ways, the more serious issue: applying a linear model to a very non-linear problem. Concentrating on the shaft resistance, let us begin by noting the results in Estimating Load-Deflection Characteristics for the Shaft Resistance of Piles Using Hyperbolic Strain Softening, and stipulating that, even with hyperbolic stress-strain considerations, up to the time of separation between the shaft and the soil the load-deflection relationship is essentially linear. This study showed that, for the specific case in question, the geometric nonlinearity of the deflecting soil around the shaft and the material nonlinearlity of the soil offset each other to a large degree. Obviously more study needs to be done but this is a start.
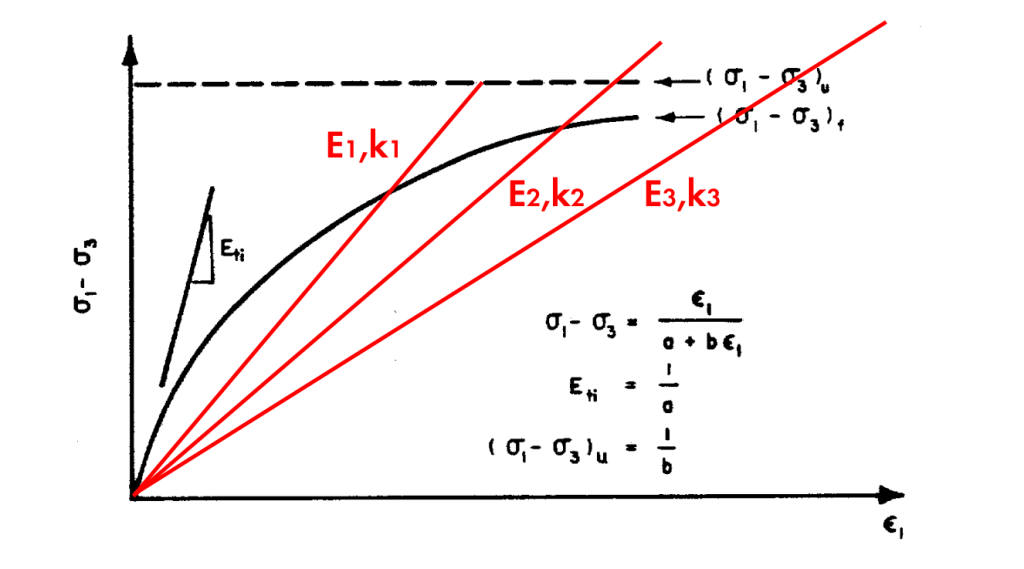
Having said that, let us look at a diagram I have used and modified over the years:
At zero strain we have the small strain elastic or shear modulus. As strain increases, if we use a linear model for load-deflection the only way the model can simulate that kind of response is to do some kind of “secant modulus” estimate. What this means is that the elastic modulus/shear modulus/spring constant is strain dependent, which will vary with loading condition (to put it in classical geotechnical terms, to what extent the shaft resistance is mobilised.) It is also worth noting that this mobilisation is not identical in static and dynamic testing, even on the same pile.
Based on all of this, it is difficult to see how the results of the inverse method can be used to accurately characterise the load-deflection characteristics of the pile, let alone the properties of the soil.
This paper is an interesting study of the problem at hand. While some significant advances have been done in the numerical treatment of the problem, the physics of the pile-soil system need to be re-examined and improved.
A fictitious soil pile (FSP) model is developed to simulate the behavior of pipe piles with soil plugs undergoing high-strain dynamic impact loading. The developed model simulates the base soil with a fictitious hollow pile fully filled with a soil plug extending at a cone angle from the pile toe to the bedrock. The friction on the outside and inside of the pile walls is distinguished using different shaft models, and the propagation of stress waves in the base soil and soil plug is considered. The motions of the pile−soil system are solved by discretizing them into spring-mass model based on the finite difference method. Comparisons of the predictions of the proposed model and conventional numerical models, as well as measurements for pipe piles in field tests subjected to impact loading, validate the accuracy of the proposed model. A parametric analysis is conducted to illustrate the influence of the model parameters on the pile dynamic response. Finally, the effective length of the FSP is proposed to approximate the affected soil zone below the pipe pile toe, and some guidance is provided for the selection of the model parameters.
The topic is an interesting one which I have touched on over the years. It seems to me that their characterisation of the model as “novel” may be a bit of a stretch but their implementation of it is very interesting.
What is a Fictitious Pile Model?
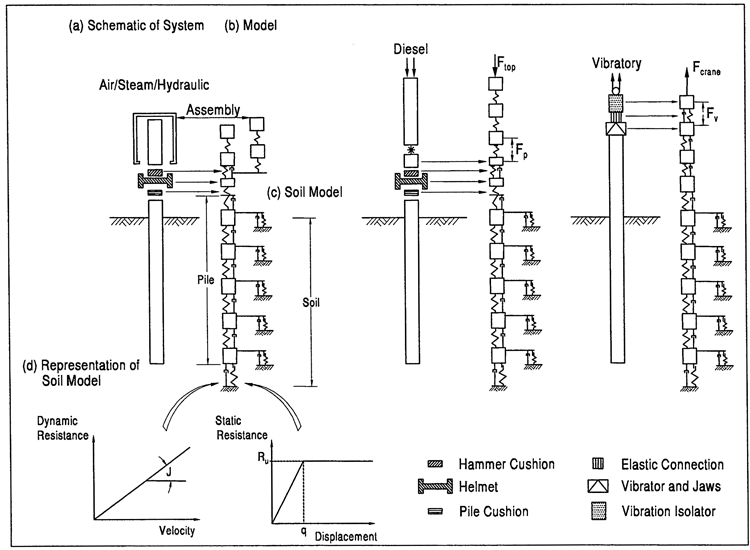
Most of us in the driven pile industry are familiar with the one-dimensional wave equation, which divides up the pile into discrete segments/elements and by doing so models the distributed mass and elasticity (or plasticity) or the system, such as is shown in Figure 1, from the Design and Construction of Driven Pile Foundations, 2016 Edition:
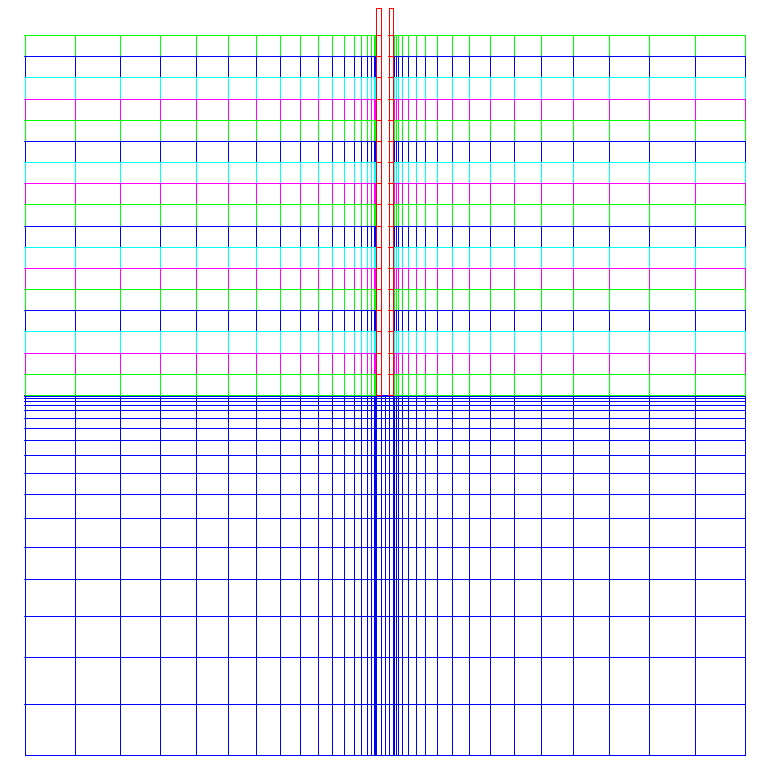
Figure 2. Cross-Section of Finite-Element Model for Pile and Soil (from Warrington (2020))
Note that the pile, which is in red, is basically a one-dimensional string of elements with distributed mass and elasticity. It’s worth noting, however, that using two- (or three- for that matter) dimensional elements enables the element to have a non-uniform stress distribution which would reflect the effect of the soil resistance, but let us set this last point aside.
Such a model as shown above models both the shaft friction along the side of the pile and the toe resistance under the end of the pile. It has been customary over the years, however, for researchers and practitioners alike to model this resistance in a rheological way. This has been easier with the shaft than with the toe, because of the complexities of the dynamic elasto-plastic response of the soil at the toe and the difficulties of establishing failure surfaces in the soil has led to many solutions of the problem.
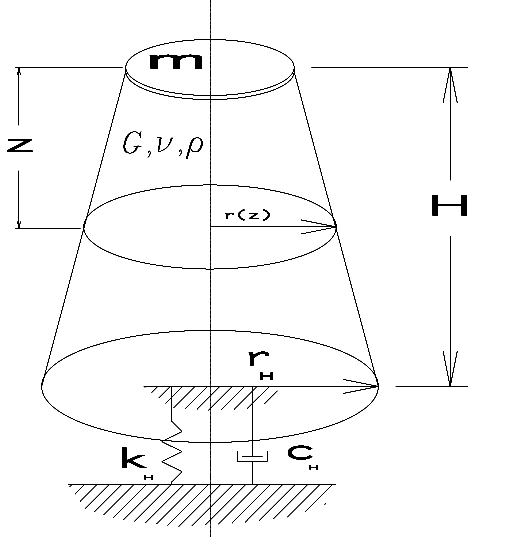
One of those is to construct a fictitious pile under the toe which, instead of the straight sides we usually (but not always) see with piles, has a conical shape, so as the distance from the toe increases the size of the fictitious pile likewise increases.
Figure 3. Fictitious Pile Model for the Pile Toe (from Holeyman (1988); Warring- ton (1997))
The first proposal of this came from Holeyman (1988) and was discussed in Closed Form Solution of the Wave Equation for Piles and more recently in the paper STADYN Wave Equation Program 10: Effective Hyperbolic Strain-Softened Shear Modulus for Driven Piles in Clay. A diagram of this is shown in Figure 3. Although the model is generally done (as is the case in the models in Figure 1) with discrete elements, it can be modeled continuously. The paper under consideration did so using finite elements. A problem that occupied this researchers and those of the paper under consideration is the value of H, which does not have an “obvious” solution from the physics of the problem.
In the work under review, in addition to using finite elements the authors made two important improvements to the model shown in Figure 3:
They added a “shaft” resistance along the side of the fictitious piles.
They put a hole in the centre of the fictitious pile to assist in simulating the soil plug, which was one of the main goals of the study. Soil plugging is a difficult phenomenon in open-ended piles, and although we’ve made some progress in modelling it we still have a long way to go.
Some Comments on the Study Itself
The authors used ABAQUS to model both piles. This is a code which has been applied to geotechnical problems for at least thirty years, so it has a long track record. Having started from “scratch” with Improved Methods for Forward and Inverse Solution of the Wave Equation for Piles, I can attest that using a software package saves a great deal of time and effort, in addition to making graphical presentation of the results a good deal simpler. Having said that, if anyone has an ambition to use FEA to replace, say, GRLWEAP or CAPWAP, they’ll have to either a) pay licensing fees to a cut down “engine” from an established package like ABAQUS or b) use an open source alternative.
At the start of the study they make the following statement:
Open-ended pipe piles are increasingly used worldwide as foundations for both land and offshore structures [1,2]; therefore, the characterization of pipe pile capacity and behavior under static and dynamic loading conditions has gained much attention in recent years [3–5].
Open ended pipe piles have been used for much longer that this paragraph would imply, as this whole series will show. Getting them in the ground was much of the impetus for the TTI wave equation program, and the lateral loads they withstood were much of the push behind the development of p-y methods. And that was in the 1960’s and 1970’s.
The soil model they use is a cross between a elastic-purely plastic model and a hyperbolic soil model. Reconciling the two has been a preoccupation of this site since Relating Hyperbolic and Elastic-Plastic Soil Stress-Strain Models: A More Complete Treatment. Although the model they use certainly takes into consideration hyperbolic strain softening, I’m not convinced that their assumption that the rebound runs along the small-strain modulus of elasticity is valid. On the other hand I’m not sure what the best way out of this dilemma is; hyperbolic soil modelling hasn’t been as thorough in analysing the stress-strain characteristics of soil during rebound as it has been in doing so during loading.
Although the relationship between the shear modulus of soils and the void ratio or porosity is well established, the coefficient used to determine the former from the latter is subject to uncertainty.
The static and dynamic shear moduli of soils is different, which is an issue in pile dynamics that has not been adequately explored.
Conclusion
The paper is an excellent step forward, and the model presented has a great deal of potential in pile dynamics. It may be easier to use such a model than a full axisymmetric or 3D model to obtain the inverse solution to the problem, but many of the issues discussed here–such as the angle and depth of the fictitious pile cone and the shear moduli of the soils in question–need better resolution.
As far as the plugging issue is concerned, any advance in this is welcome, although I am inclined to think that a model which simulates the full, blow-by-blow installation of the pile with the formation of the plug, will ultimately be the best solution of the problem.
One especially interesting aspect of this study was the inclusion of a pile cap. The problem is similar to the the one I discuss in my post When Semi-Infinite Spaces Aren’t, and When Foundations are Neither Rigid Nor Flexible, where the foundation is neither perfectly flexible relative to the soil nor perfectly rigid. Although in this study the foundation rigidity is not varied, the soil’s is, and as is the case in elastic theory as the soil becomes less rigid the relative rigidity of the foundation increases, the soil stresses relative to the foundation towards the edge of the foundation likewise increase. This Fall I plan to include that elastic theory in my discussion of mat foundations here: Foundation Design and Analysis: Shallow Foundations, Other Topics.
I noted a drop in the shaft friction just before the toe, followed by an increase down to the toe itself. The interaction between pile, soil and shaft friction for deep foundations is a complicated one. The toe creates failure surfaces in the soil that are certainly there–and it is reasonable to assume that they affect the shaft friction near the toe as well–but they are not exactly like those generated in shallow foundations, something which has complicated toe resistance calculations for a long time. The relative uniformity of the unit toe resistance makes sense based on failure theories going back to at least Vesić’s work in the early 1970’s. One thing that bored piles do not have to consider is the effects of advancement due to impact which, as Mark Randolph’s work has shown, almost show a “leading edge” effect.
It is my opinion that 3D FEA will ultimately be our best tool for estimating the load/settlement characteristics of deep foundations–bored or driven, static or dynamic–and this paper is a step forward in that regard.
I’ve dealt with the issue of consolidation extensively since my first post on the subject, From Elasticity to Consolidation Settlement: Resolving the Issue of Jean-Louis Briaud’s “Pet Peeve”. His problem was the lack of relationship between the way we handle consolidation settlement vs. elastic settlement. In this post I plan to look at a different problem, i.e. the way we express the relationship between soil pressure and consolidation settlement, or settlement by rearrangement of the particles.
Up to now…
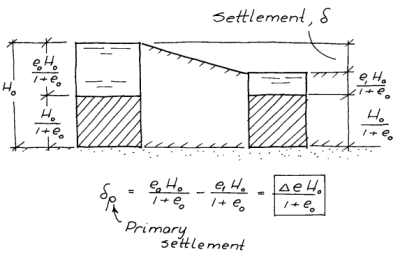
Graphic 1
Let’s start with the diagram at the right, from Broms (as will be the case with the graphics we use.) Soil is made up of a combination of soil particles and voids between them. The voids can be filled with air, water or (God forbid) something else. For saturated soils water, for practical purposes, fills all of the voids.
In any case, for illustrative purposes we can “melt” the solids into a continuous solid and leave the rest as a void. We assume that the solids do not compress during the application of pressure and thus their volume is constant. From the first state (on the left) to the second state (on the right) additional pressure is applied. All the change of the volume must take place in the void; the equation at the bottom is based purely on the geometry, where is the height of the layer being compressed, is the initial void ratio of the soil, is the change in void ratio during compression, and is the primary settlement of the soil.
Graphic 2
Unfortunately, as discussed elsewhere on this site, the relationship between the increase in pressure and the settlement/change in the volume of the voids isn’t linear but (empirically) logarithmic. That is shown in the graphic on the left; once the pressures get past the ambient effective stress, the settlement takes places according to the relationship shown at the bottom of the graphic. Here is the compression coefficient, is the effective stress, and is the change in pressure on the soil at a given point.
Combining the two equations in the two graphics yields the “accepted” form of the consolidation settlement equation for normally consolidated soils, thus
(1)
To this deceptively absolute state of affairs Verruijt has the following objections:
We should be using natural logarithms instead of common ones. Common logarithms date from the days when engineers used logarithmic and semi-logarithmic paper, determining graphically. The compression coefficients would be changed by multiplying or dividing (depending on the form, more on that shortly) by a factor of 2.3. In an era of spreadsheets and MATLAB, natural logarithms would make more sense (and reduce student mistakes,) but I don’t see that changing.
We should use the strain rather than the void ratio. Actually, as Verruijt points out, this is done in Continental Europe. In the U.S. and Scandinavia, void ratio is used as the parameter of deflection. To change this would require a change in the compression coefficient, and that leads to…
…his preferred form of the compression equation, which would look like
(2)
where is another form of the compression coefficient. (Well, actually, he’d prefer natural logarithms, but as I said let’s put that aside.)
Multiplying both sides of Equation (2) by gives us
(3)
The two compression coefficients are related as follows:
(4)
Actually a variant of Equation (4) finds its way into American practice in Hough’s Method for sands, which is described in the Soils and Foundations Reference Manual.
Enter NAVFAC DM 7.1
The “New” NAVFAC DM 7.1 (Soil Mechanics) is an excellent compendium of the current state of geotechnical practice relating to soil mechanics. In the process of discussing consolidation settlement, it highlights some recent changes that promise to add to the confusion described above.
For normally consolidated soils, Equations (1) and (3) are written as follows
(5)
where is the modified compression index. This means that Equation (4) can be expanded as follows:
(6)
Whether we can dispense with the initial void ratio is a separate topic. Assuming that we can, what we have is a situation with three different compression coefficients, all designated with some form of , and none of them the same. (If we threw in natural logarithms, we’d have six.) The potential for confusion is evident, no where than when two of the three coefficients end up in the same table:
And Secondary Compression…
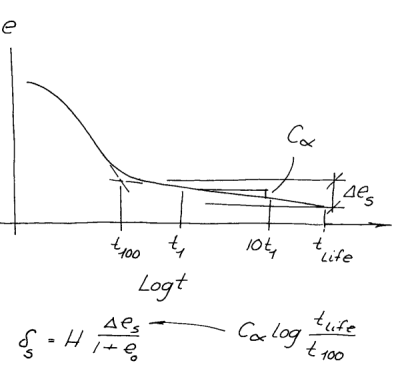
Graphic 3
Secondary compression has had the problem for much longer. If we look at Graphic 3 on the right, we see that we have a secondary compression coefficient . The presentation is a little hard to follow but the secondary compression equation is
(7)
where is the amount of secondary compression, is the coefficient of secondary compression, is the life of the structure and is the time at which 100% of primary compression has taken place. (Of course that’s a source of confusion in itself because, in theory, 100% primary compression is never achieved, something that buffaloed many of my students on a test last semester.)
However, as NAVFAC DM 7.1 points out, we can also write this as
(8)
where the modified secondary compression coefficient is
(9)
So what is to be done?
My advise to students and practitioners alike is to be vigilant and careful. Make sure you understand which coefficient is being called for. For software, make sure you completely understand which coefficient is being used by the software; otherwise, you will have the classic “garbage in/garbage out” result. Verruijt hoped that we would come to uniform practice but we can’t wait for this; we have to get our work done, and we need to do it carefully.

 (1)
(1)
 is the height of the layer being compressed,
  is the initial void ratio of the soil,
  is the change in void ratio during compression, and
  is the primary settlement of the soil.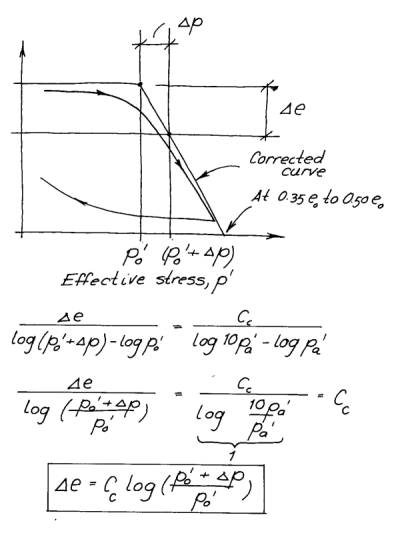
 is the compression coefficient,
  is the effective stress, and
  is the change in pressure on the soil at a given point.
 (1)
(1) (2)
(2) is another form of the compression coefficient. (Well, actually, he’d prefer natural logarithms, but as I said let’s put that aside.)
 (3)
(3) (4)
(4) (5)
(5) is the modified compression index. This means that Equation (4) can be expanded as follows:
 (6)
(6) , and none of them the same. (If we threw in natural logarithms, we’d have six.) The potential for confusion is evident, no where than when two of the three coefficients end up in the same table: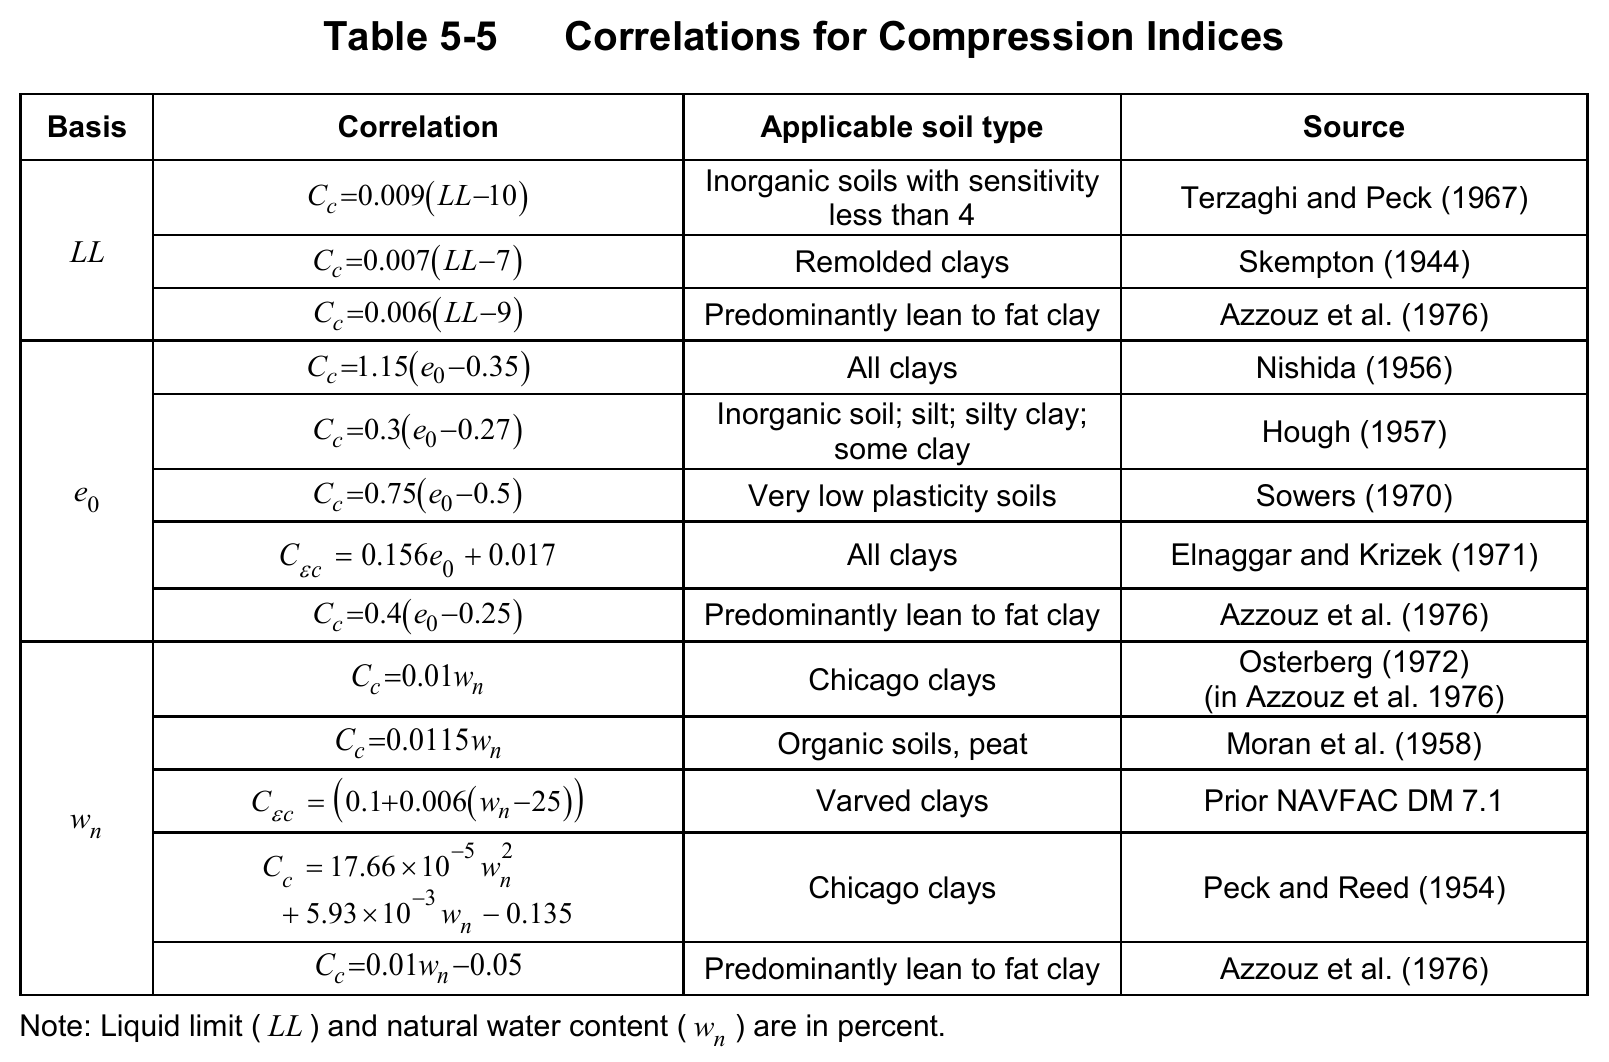
 . The presentation is a little hard to follow but the secondary compression equation is
 (7)
(7) is the amount of secondary compression,
  is the coefficient of secondary compression,
  is the life of the structure and
  is the time at which 100% of primary compression has taken place. (Of course that’s a source of confusion in itself because, in theory, 100% primary compression is never achieved, something that buffaloed many of my students on a test last semester.)
 (8)
(8) (9)
(9) vulcanhammer.net