Our newest research item is this one, which is an expansion of the work with steel piles earlier this year. Abstract is as follows:
The application of semi-infinite pile theory to the behaviour of driven piles has been studied since Parola (1970). Most of the effort, however, has been concentrated on piles which do not require a cushion between the pile head and the pile driving accessory, such as steel piles. Concrete piles, on the other hand, are generally driven with this additional cushion. In this paper the same type of semi-infinite type of analysis is applied to this problem. Both the case of a rigid pile head and a pile head which responds without reflection from the pile are studied using both closed-form and numerical solutions. Two case histories are included which illustrate the application of the method, along with parametric studies of both pile head conditions.
Spears Laboratory Spreadsheet. A multipurpose spreadsheet for many basic lab tests (sieve, hydrometer, Atterberg limits, Proctor tests, etc.) but it takes some practice to get it right. It’s really easy to mess things up if you don’t know what you’re doing, so be careful.
In the process of classifying soils using the Unified System, one of the parts which some students find tricky is the business of the “proportion of the coarse fraction,” i.e., the way we decide if a mostly coarse-grained soil sample is sand or gravel. This is an attempt to illustrate this using a pie chart.
First, for purposes of the Unified System of soil classification, for particle distribution size by weight/mass all soils can be broken down into three parts:
Gravel, the portion of the sample retained on the #4 sieve
Silt and Clay/Fine-grained portion, the portion which passes the #200 sieve (or, put a little eccentrically, retained on the pan)
Sand, what’s left over from the first two portions
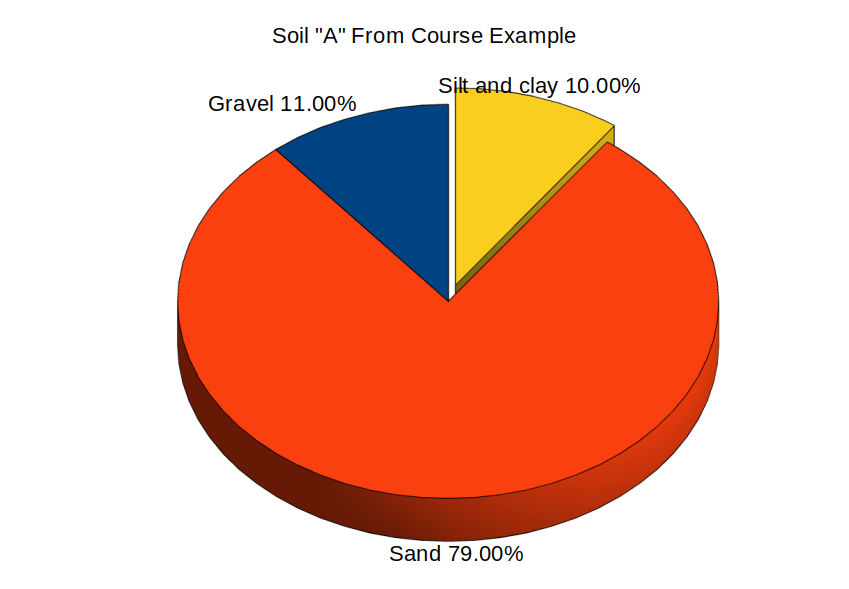
Let’s start with an example, the Soil “A” from the course example, which has a fine fraction of 10% and a gravel portion of 11%. Conventionally, we would say that the coarse fraction is 90% of the weight, and that the gravel portion of the coarse fraction is 11%/0.9 = 12.1%. Since the sand portion is 100% – 12.1% = 87.9%, the sand portion is greater, and thus the soil is a sand. This is correct but confusing to beginners.
If we were to graph the three portions in a pie chart, it would look like this:
We break out the fine grained (silt and clay) portion and see immediately that the sand fraction is larger than the gravel. Since the combination of the two are most of the soil (overwhelmingly in this case) the soil is a) coarse-grained and b) a sand.
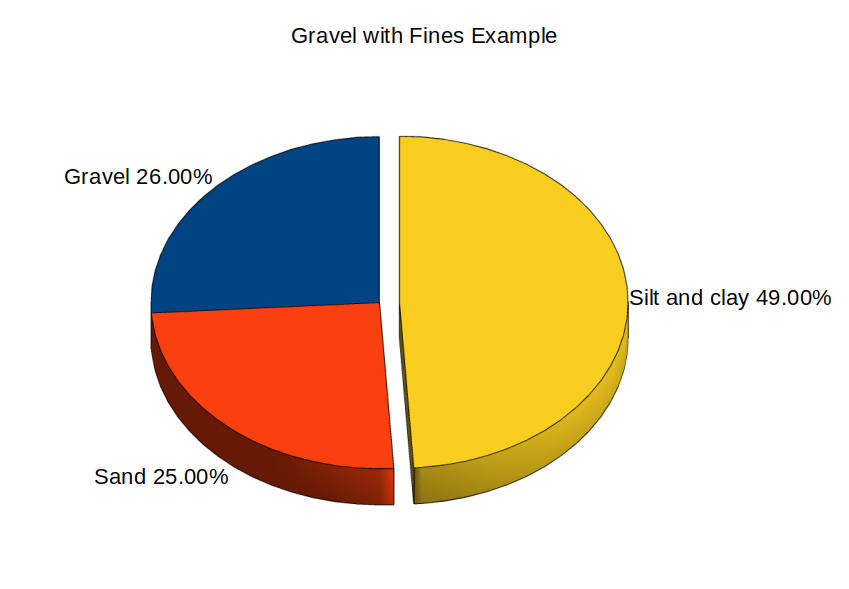
Let’s look at something a little more challenging: a soil which is only slightly predominantly course grained:
The soil is split 51/49 coarse-grained, so it’s classified as coarse grained (S or G.) We could go through the math like we did earlier, but the pie chart, be it ever so closely, shows that the gravel portion is slightly (26 vs. 25) larger than the sand portion. So this would classify as a gravel, GM or GC depending upon the Atterberg limits.
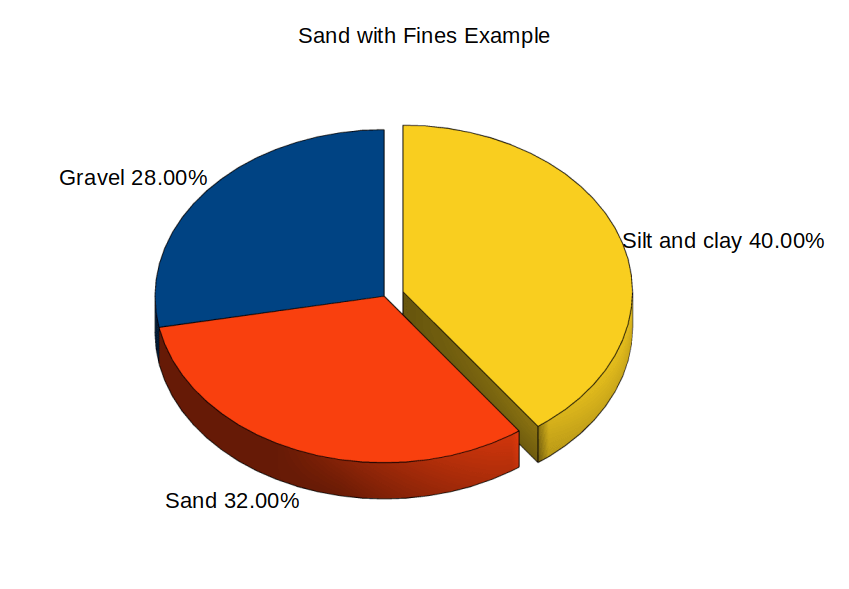
Here’s another example, this time with the fine fraction reduced. Here the sand is slightly larger than the gravel (32 vs. 28) and so the soil will classify as a sand, SM or SC.
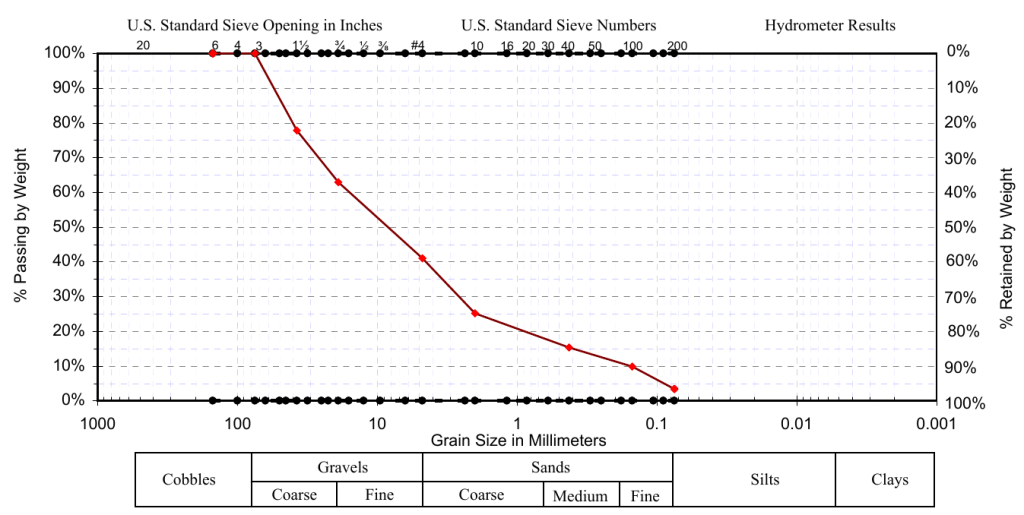
For our last example, let’s do an entire soil classification. The gradation chart looks like this:
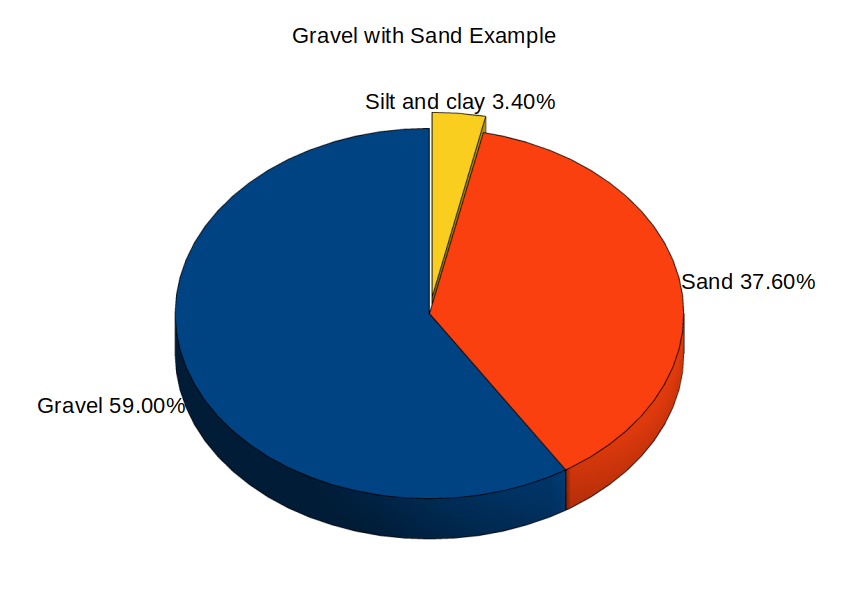
From this, we can construct our pie chart as follows:
From the pie chart we see two things:
The silt and clay fraction is only 3.4%; this is obviously a coarse-grained soil, and given the low portion of fines a clean one.
The gravel portion is obviously larger than the sand, thus this is a gravel, “G” classification.
Since the fines are so low, it is either a GW or GP. We can determine which by looking at the coefficients of uniformity and curvature. Using the method shown in the Soils and Foundations Manual, these are as follows: , from which . In the Unified System this is a well graded soil, hence the classification is GW.
We can see from this that the pie chart visualisation is a useful tool when attempting to understand whether a coarse-grained soil is predominantly sand or gravel. It also helps us to see that the “hard” distinctions of the Unified System are not necessarily the whole story of a soil sample, which is why experience is so important in geotechnical engineering.


 , from which
  . In the Unified System this is a well graded soil, hence the classification is GW.