
This post was originally meant to supplement my course post Foundation Design and Analysis: Retaining Walls, Braced Cuts but it being updated as a supplement for my book Soils in Construction. It is also being updated to tackle the issue of the “hinged wall” which has been an issue with this methodology ever since.
Most retaining walls are designed with active or passive earth pressures derived from Rankine, Coulomb or Log-Spiral theories. One notable exception to that are braced cuts. The development of the earth pressure distributions is attributable to Karl Terzaghi and Ralph Peck, a process outlined in the post Getting to the Bottom of Terzaghi and Peck’s Lateral Earth Pressures for Braced Cuts. In the process of developing those, the way the wall is modelled was simplified to avoid statically indeterminate structures. Although this is not the problem that it was in their day, the method is still dependent upon those statically determinate structures.
The example below is a simple example in that the supports are symmetrically placed and there is no sheeting toe penetrating the bottom of the excavation. It’s primarily intended to illustrate the concepts, both geotechnical and structural, of the design of these structures.
Overview of the Example
Problem Statement
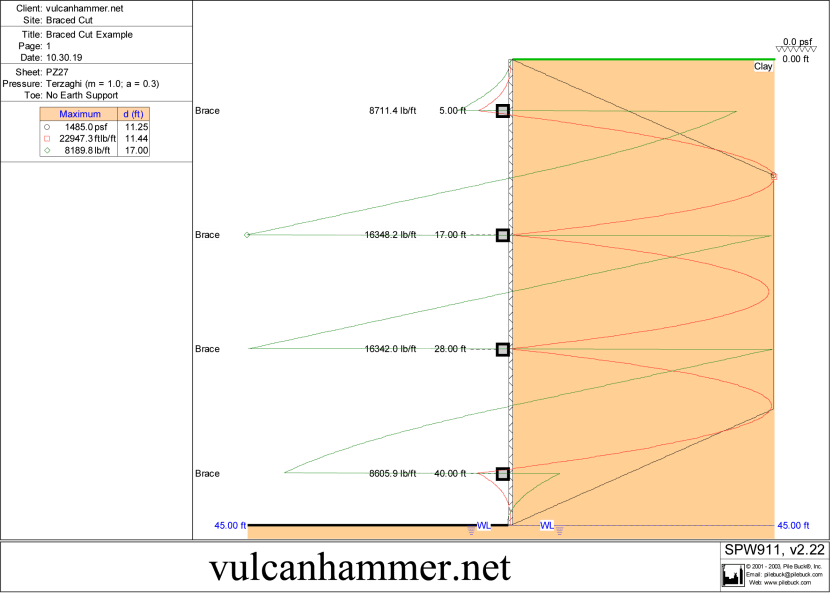
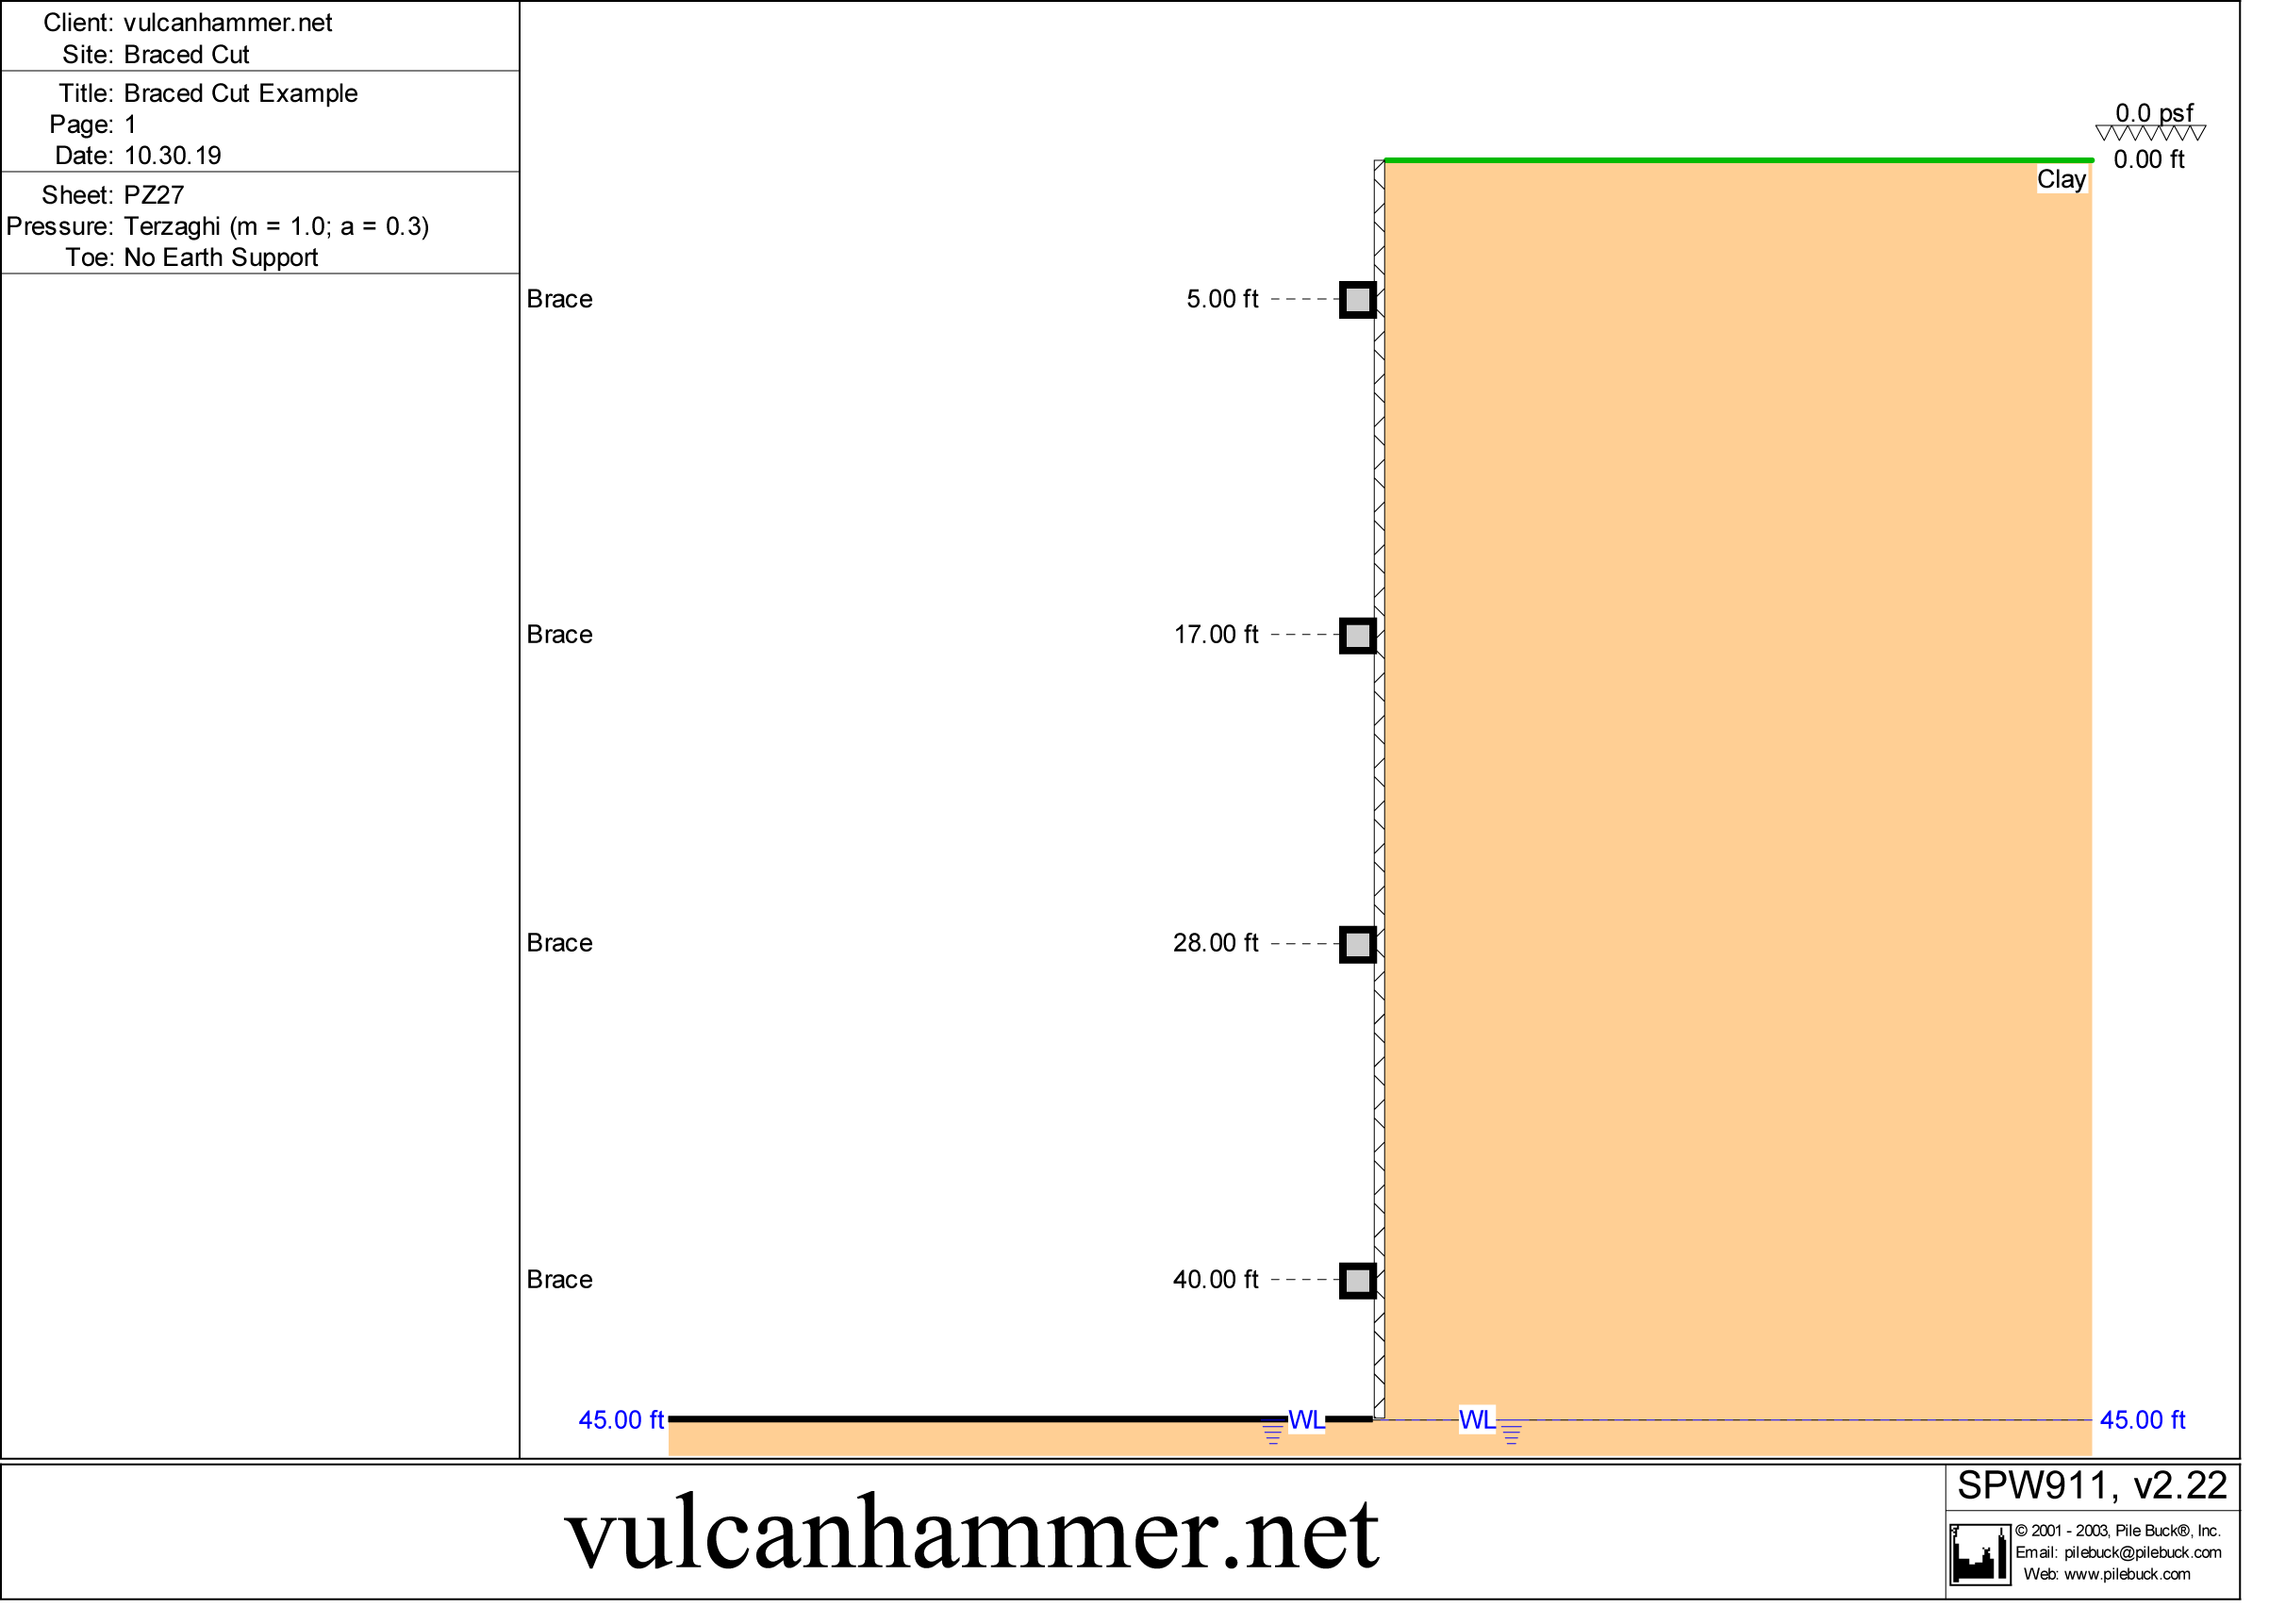
Let us consider a braced cut excavation which is 45′ deep and which has supports at a depth of 5′, 17′, 28′ and 40′. The soil behind the wall is uniform with c = 1100 psf and γ = 110 pcf. The water table is at the bottom of the excavation and does not enter into our calculations. To show how this lays out we’ll use Pile Buck’s SPW 911 sheet pile software. We’ll assume PZ-27 sheeting is being used, and that there is no surcharge on the wall.
The options for earth pressure distribution behind braced cuts are shown below, from NAVFAC DM 7.2. or Sheet Pile Design by Pile Buck.
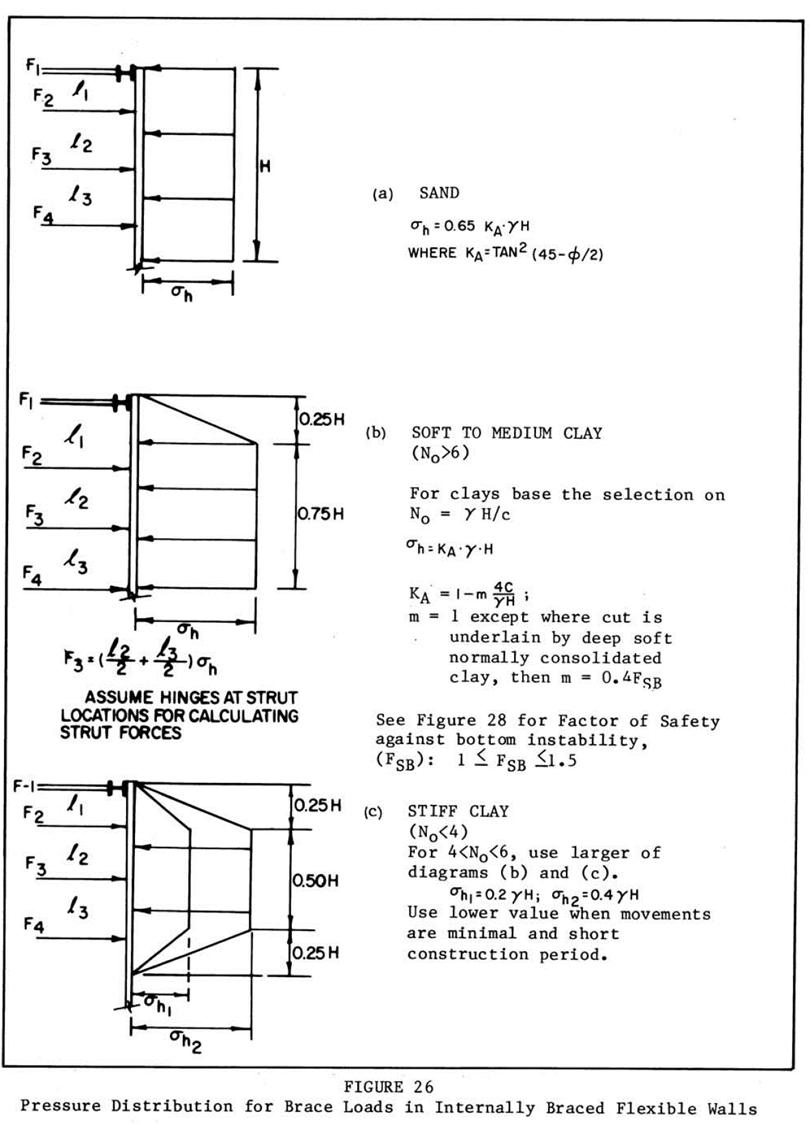
We obviously have a clay soil, thus our selection will be either (b) or (c). Whether the soil is soft to medium or stiff depends upon the stability number 
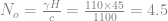
This is between (b) and (c), we are thus supposed to use the “larger” of the two diagrams. The earth pressure coefficient for (b) is

Assuming m = 1,

and thus

If we turn to Case (c) and assume that

this is obviously “larger” than Case (b), so we will use Case (c), even when using a “medium” case between the two extreme pressure profiles.
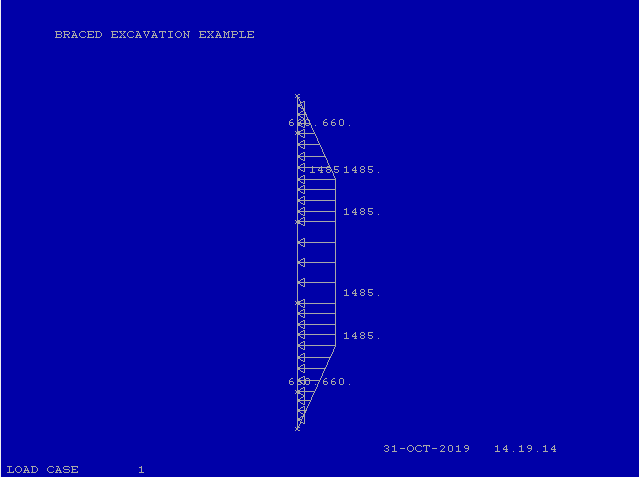
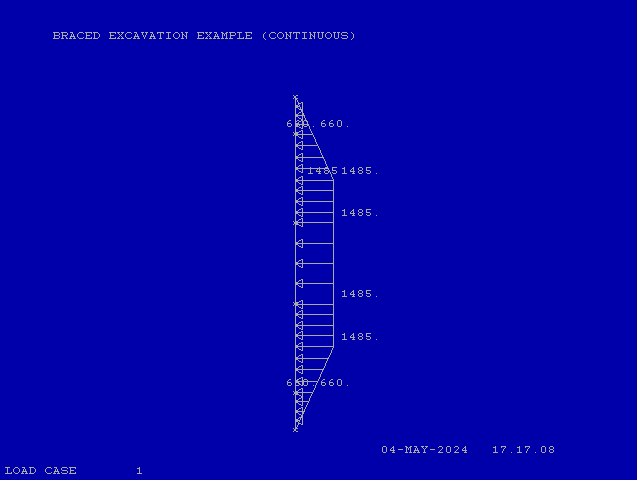
We thus have a pressure distribution that can be described as follows:
- Beginning at the top, it linearly rises from zero to the maximum value of 1485 psf at a point a quarter down the wall, or 45/4 = 11.25′.
- From that point until a quarter from the bottom of the wall, or 0.75 * 45 = 33.75′, it is a constant pressure of 1485 psf.
- From that point until the bottom of the wall, it linearly decreases to a value of zero at the bottom of the wall.
We will analyse the wall using two different approaches to the structural analysis and three different implementations:
- Hinged Solution
- CFRAME finite element software
- SPW 911 sheet pile software
- Continuous Solution: CFRAME finite element software
A similar comparison can be found in Sheet Pile Design by Pile Buck.
Solution I: Hinged Solution
Turning to the structural aspects of the wall, the guidelines for dividing the wall up for the hinged method are as follows:
- If the wall is cantilevered at either end, then the endmost support and the one next to it form a simply supported beam with a cantilever at one end and a distributed load.
- Segments in the middle are analysed as simply supported beams with a distributed load.
- If there’s a support at the top or the bottom of the wall, the beam at that location is analyzed as a simply supported beam.
- Reactions are computed for each beam. For supports where two segments meet, you simply add the two reactions from each beam for a total reaction for the support.
- Maximum moments are computed for each beam; the largest of these maximum moments is the maximum moment of the system and the one used to size the sheeting.
Since the distributions are simple, “handbook” type formulas can be used. The trout in the milk takes place (as it does here) when the break points in the distribution don’t coincide with the supports, in which case you end up with a more complicated distribution. There are two ways of dealing with this problem.
The first is to reduce the distributed loads to point load resultants. This is a favourite tactic among geotechnical engineers and is used extensively with shallow foundations. For purely hand calculations, it makes sense. The moments will be higher (which is conservative) but the reactions will be identical, assuming the concentration of the moments went off according to plan.
The second is to employ beam software to analyse each segment. Although there’s a lot of beam software out there, being the old coots we are, we’ll use CFRAME, a DOS program for two-dimensional structures. It gets the job done and is fairly easy to use. (Note: because of some bad interaction between CFRAME and DOSBox, we ran it on a Windows XP installation. The manual for CFRAME: Computer Program with Interactive Graphics of Plane Frame Structures is here.)
We will also use the SPW 911 software to compare the results, which also uses the hinged method of structural analysis.
Implementation in CFRAME
The first thing we need to do is to specify the distributed loads. CFRAME, like most finite element programs, considers the beam between each support (and the beams from the outermost supports to the cantilever element) as one element. So there are six elements. CFRAME asks us to specify the distributed load (constant or linearly varying) for each element, and requires us to specify the constant loads and the varying loads separately.
But here we run into something that trips up students. Sheet piles are analysed as beams, but they’re “infinite” beams; we analyse them in terms of moment of inertia per length of wall, section modulus per length of wall, load per unit length of wall, etc. The good news is that, for distributed loads, the pressure at any point is the load per unit length! Pressure is expressed, in this case, as lb/ft^2 of wall, when in reality it’s lb/ft/ft of wall. That makes things simpler; as long as we enter the moment of inertia and cross sectional area in terms of “per foot of wall” (which any US unit section should furnish us) then we’re good. In this case for PZ-27 the moment of inertia is 184.2 in^4/ft of wall and the cross-sectional area is 7.94 in^2/ft of wall, and these are entered directly into CFRAME.
With that technicality out of the way, for are areas of constant earth pressure (the middle) we’re also good; it’s just 1485 psf, and we enter this directly into CFRAME. With the ramped portions, they increase from the top and bottom of the wall at a rate of 1485/11.25 = 132 psf/ft from the end. Looking at the topmost element, which we enter into CFRAME as (surprise!) element 1, the pressure at the topmost support is 132 * 5 = 660 psf, which we enter as the maximum pressure for the “triangle load” on the top element.
For element 2, we have two loads. The first is a continuation of the ramped load from 660 psf at the top end of the beam to 1485 psf at a point 11.25′ from the top of the wall or 11.25′ – 5′ = 6.25′ from the top end of the beam. The second load is simply a constant load to the bottom end of the beam.
The middle element 3 has a constant distribution across its entire length. The bottom two elements are mirror images of the top two elements.
Results from CFRAME
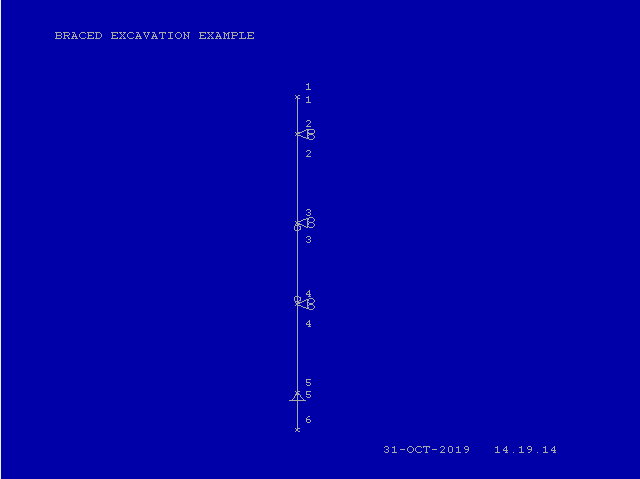
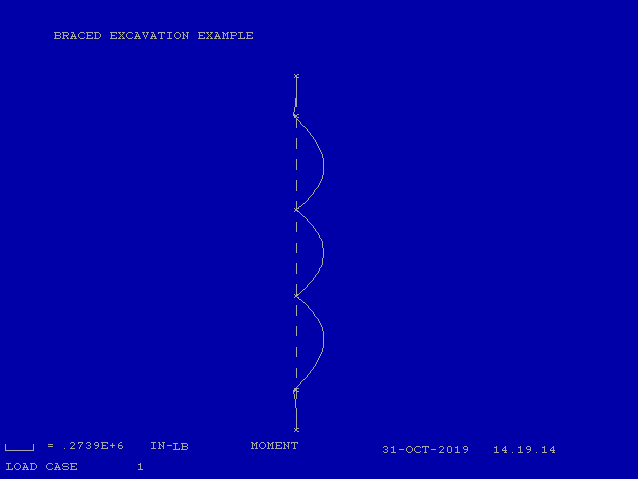
We entered the data into CFRAME via a small text file. First we present the model itself.
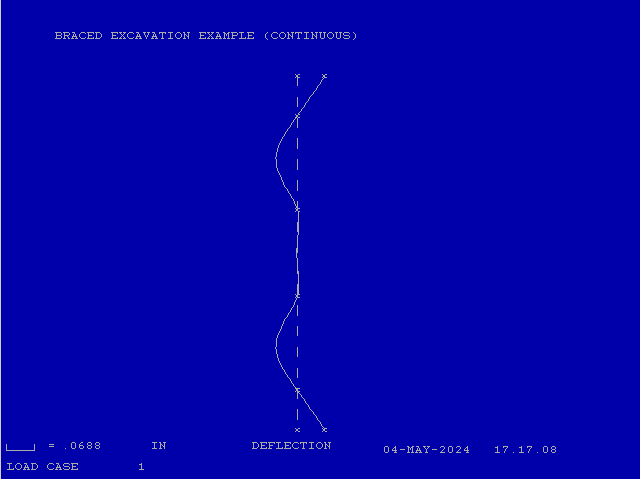
Now we show the results.
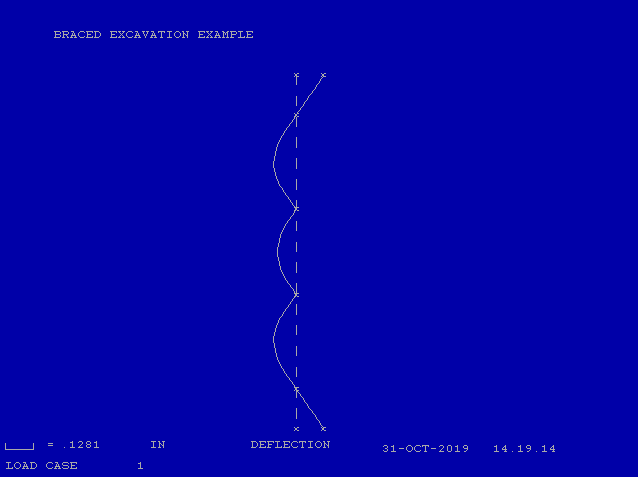
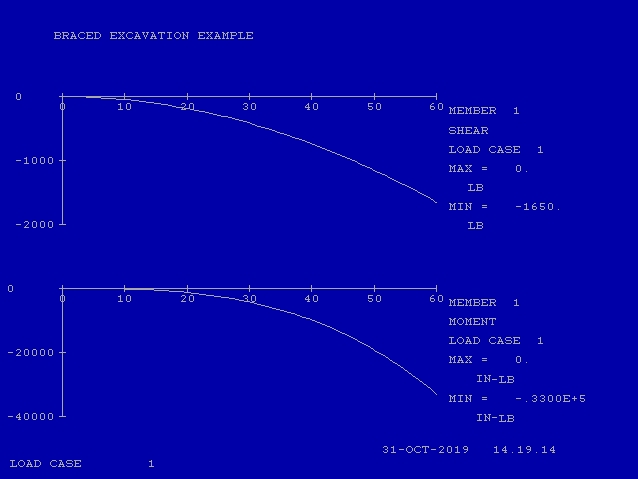
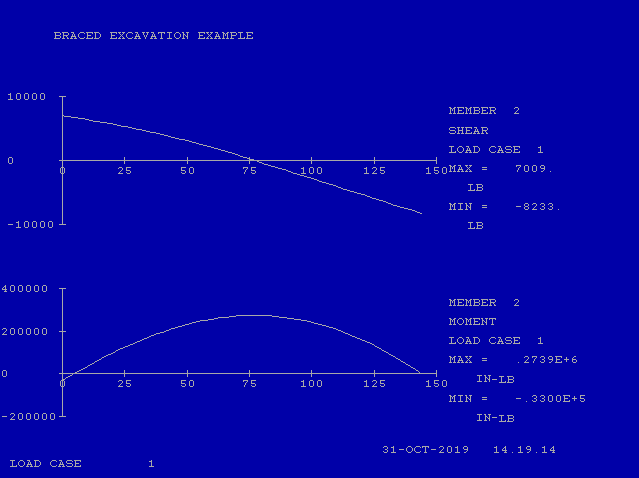
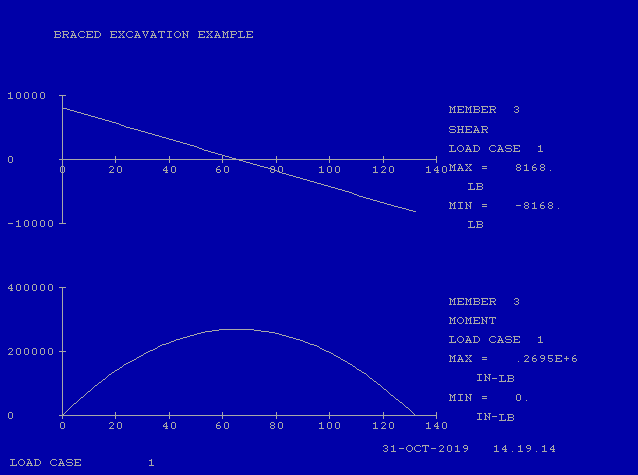
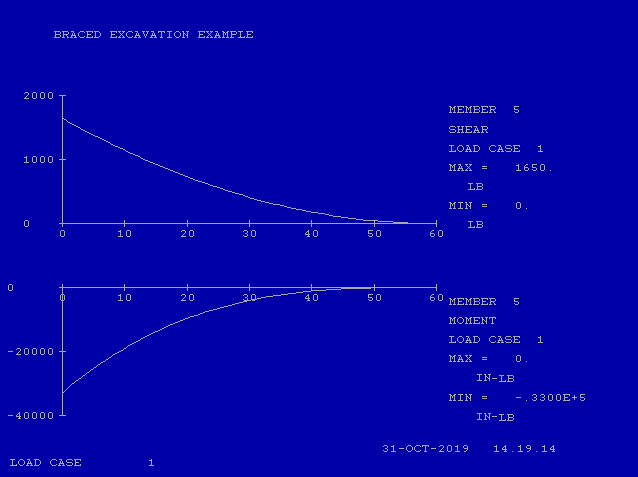
The individual element results are shown below. The tabular results of the program are here.
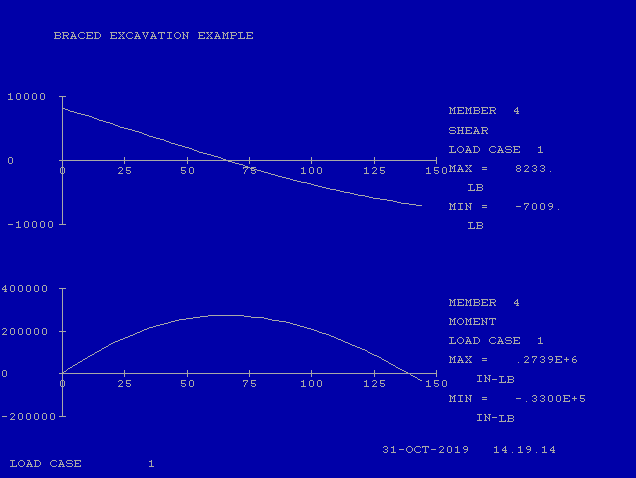
Discussing the Results
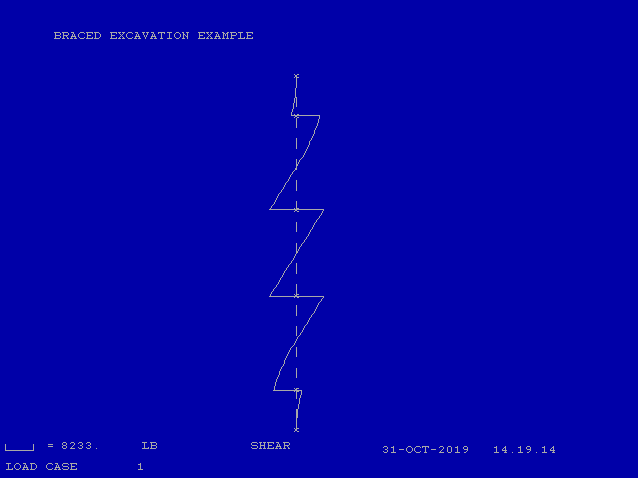
First let’s look at the reactions at the supports, which come from the element results. They are as follows:
- Support 1 (Node 2): The reaction/shear at that point from element 1 is 1650 lb/ft of wall and from element 2 7009 lb/ft of wall, summing it comes to 8659 lb/ft of wall.
- Support 2 (Node 3): The reaction/shear at that point from element 2 is 8233 lb/ft and from element 3 8168 lb/ft, summing it comes to 16401 lb/ft.
- Support 3 (Node 4) is the same as Node 3 by symmetry.
- Support 4 (Node 5) is the same as Node 2 by symmetry.
Thus the maximum brace load is on Supports 2 and 3, 16401 lb/ft. We have for convenience ignored the sign conventions and simply added the reactions, since they’re all in the same direction.
The maximum moment is actually in Element 2 (or 4,) and is 273,900 in-lb/ft of wall. Since the elastic section modulus for PZ-27 is 30.2 in^3/ft of wall, the maximum bending stress is 273,900/30.2 = 9070 psi, which is well within most allowable specifications. A lighter section can probably be employed, depending upon the allowable deflection and other requirements.
As a quick check, for a uniformly distributed load on a simply supported beam, the maximum moment is given by the equation

Substituting the values for Element 3, we have

Analysis with SPW 911
Now we compare these with SPW 911, whose output is as follows:
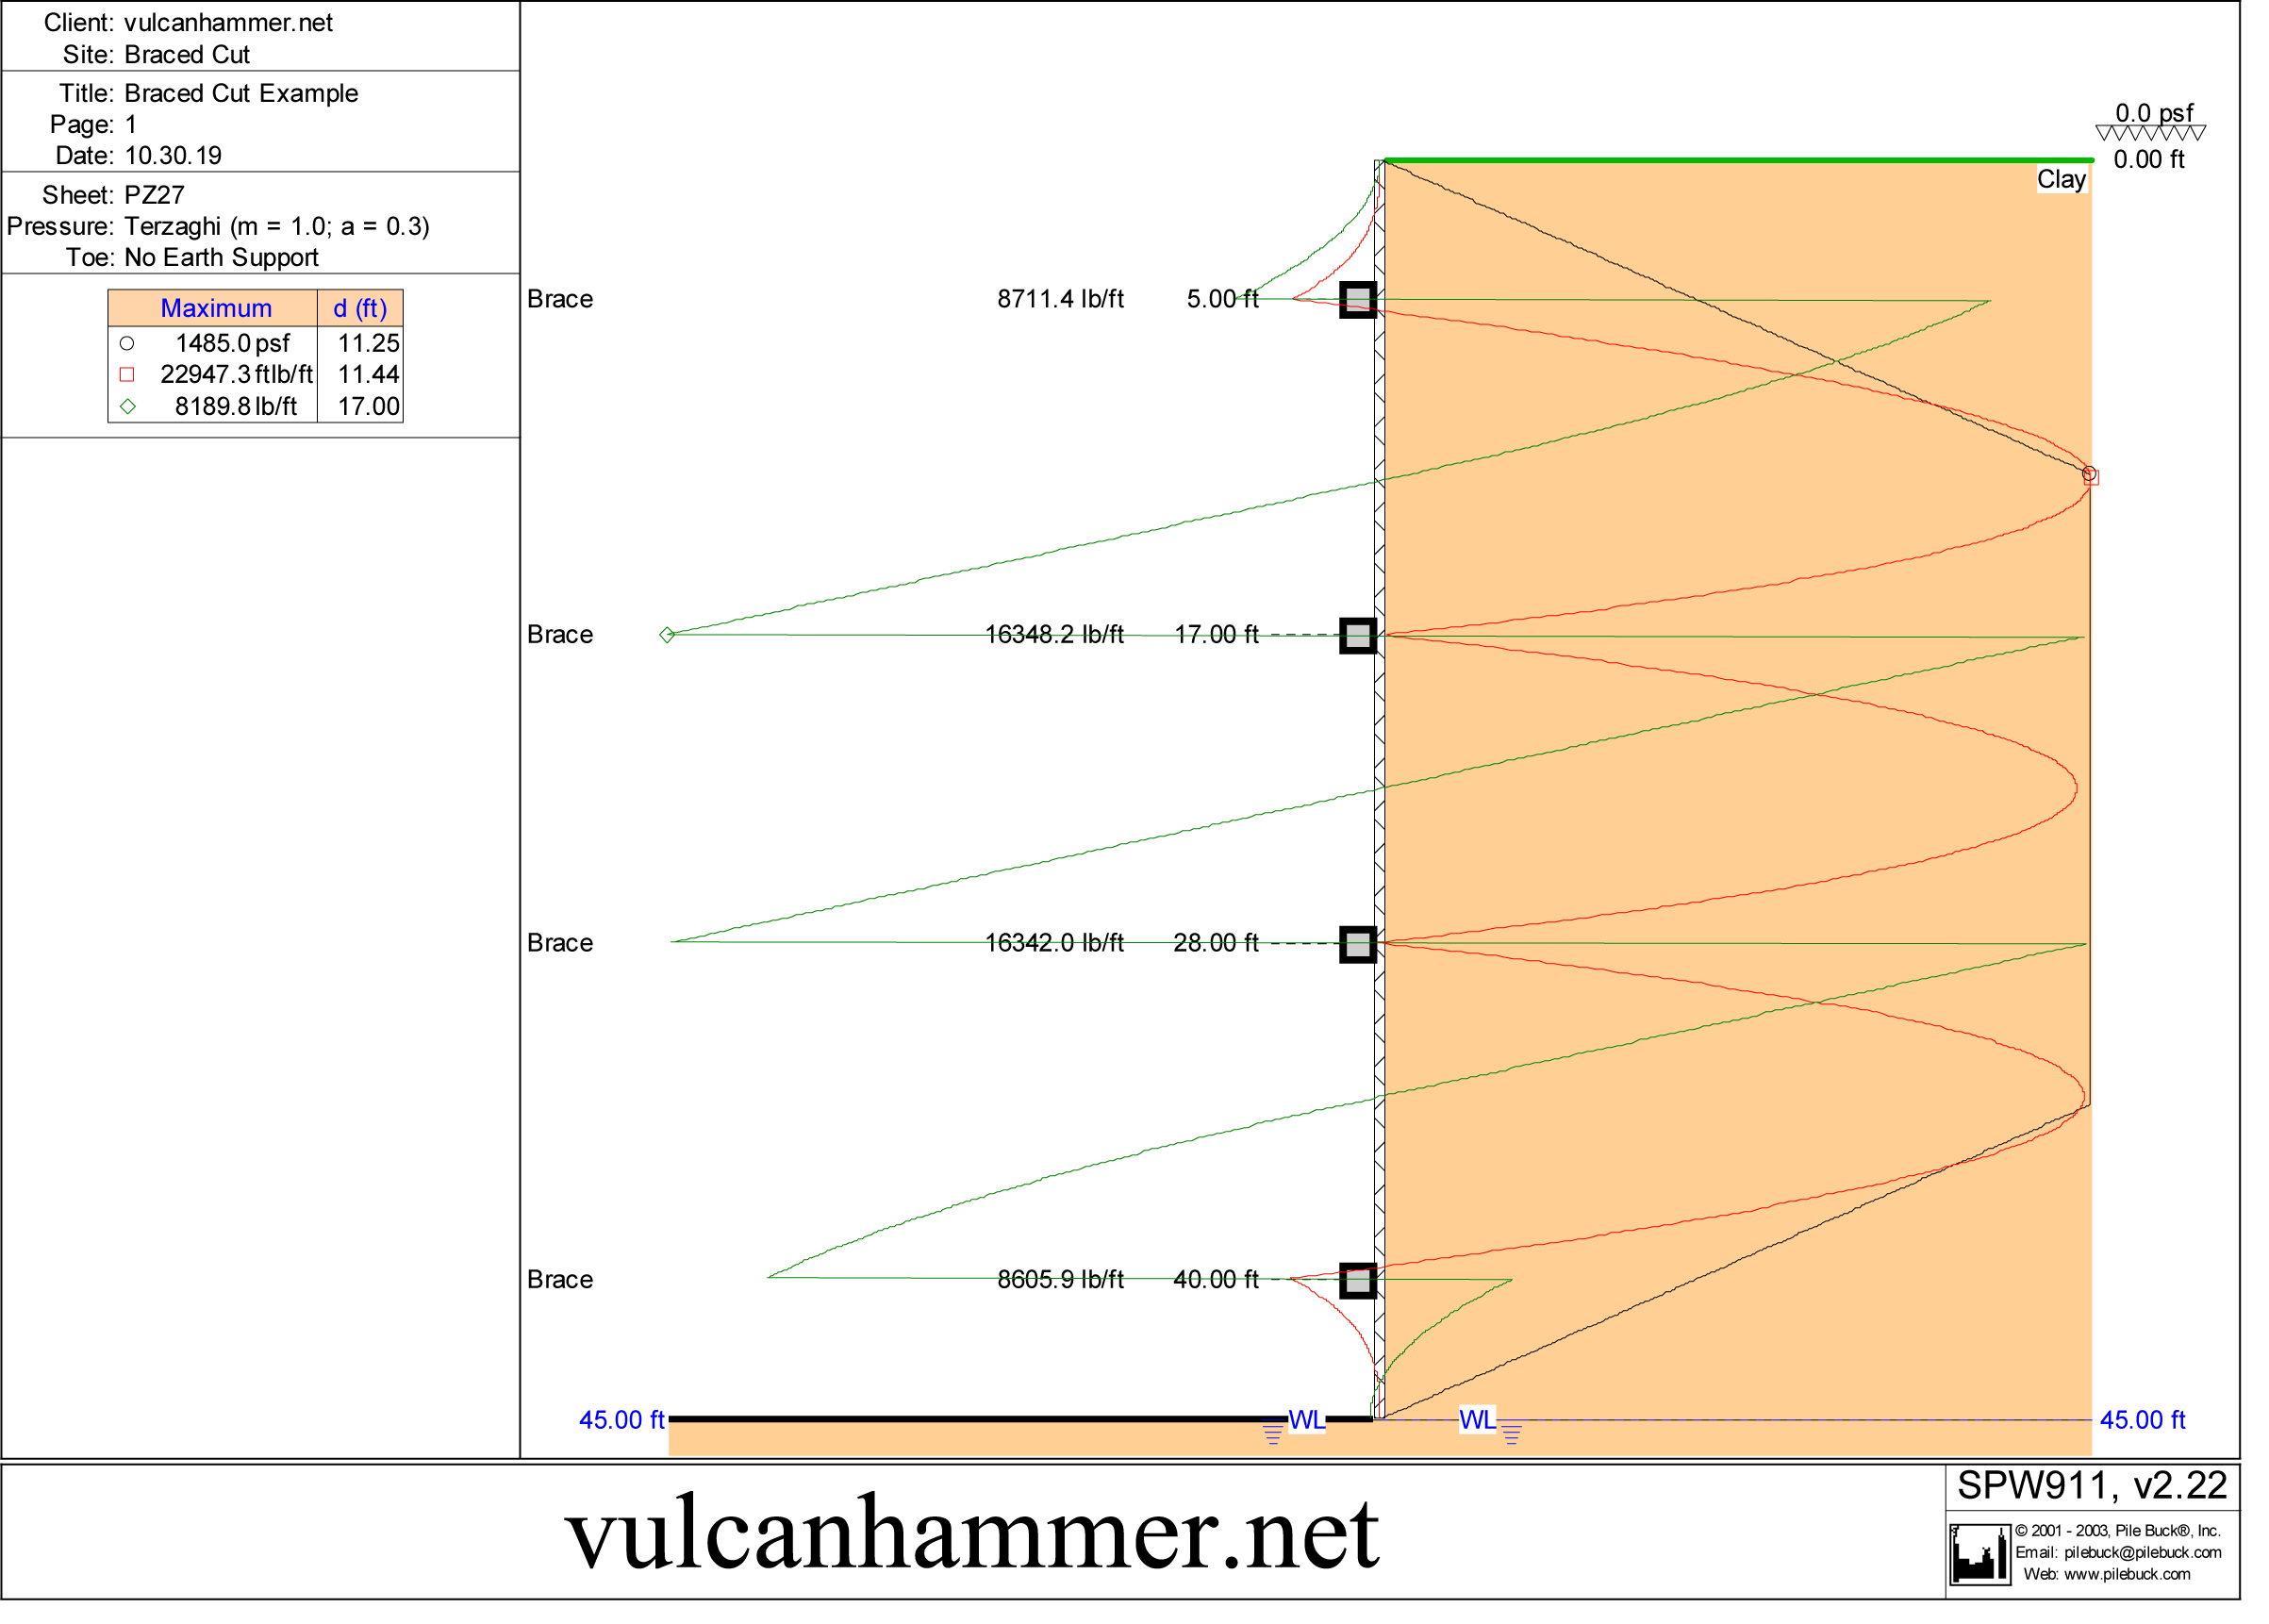
The results are compared with each other below.
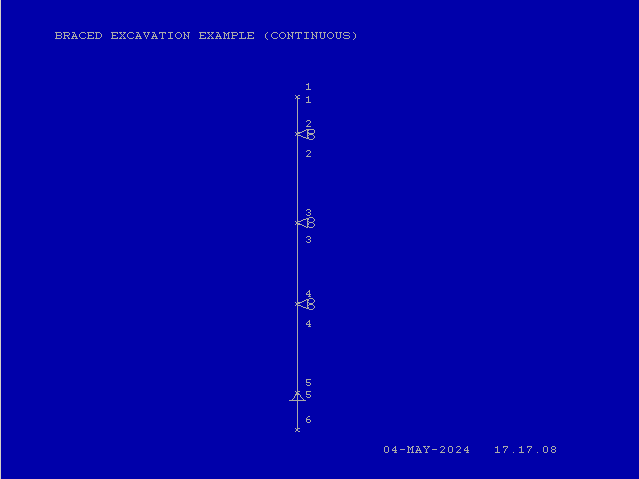
Solution II: Continuous Solution
The setup for this solution, except for the beam itself, is very similar to the hinged solution. First, the basic structural model is shown.
The detailed graphical results are omitted. The tabulated results are shown here.
Comparing the Methods
The simplest way of comparing all three methods is to tabulate the highlights. Let us begin by looking at the brace/strut loads.
| Strut Loads, lb/ft of wall | ||||
| Analysis Method | Node 2/ Strut 1 | Node 3/ Strut 2 | Node 4/ Strut 3 | Node 5/ Strut 4 |
| CFRAME, Hinged Method | 8659 | 16400 | 16400 | 8659 |
| SPW 911 | 8711 | 16348 | 16342 | 8606 |
| CFRAME, Continuous Method | 7133 | 17930 | 17930 | 7133 |
As one would expect, the CFRAME hinged method and SPW 911 are very close, as both hinge the beams. The continuous method tends to shift the loading to the vertical centre of the wall; the brace loads are less at the top and the bottom and greater at the centre. If the braces, for example, are designed for the maximum strut load, they would be sized larger using the continuous method.
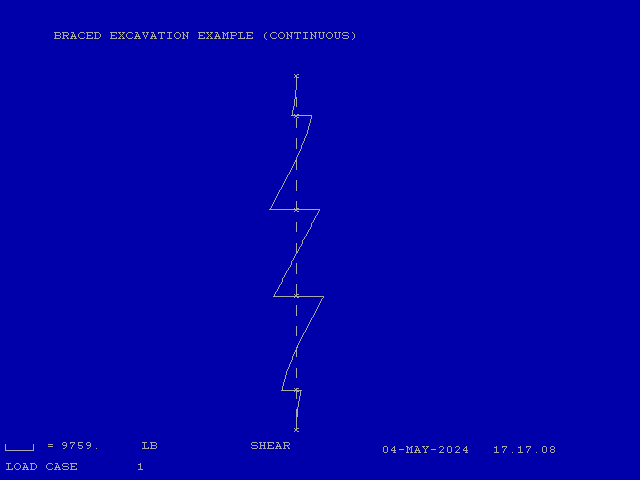
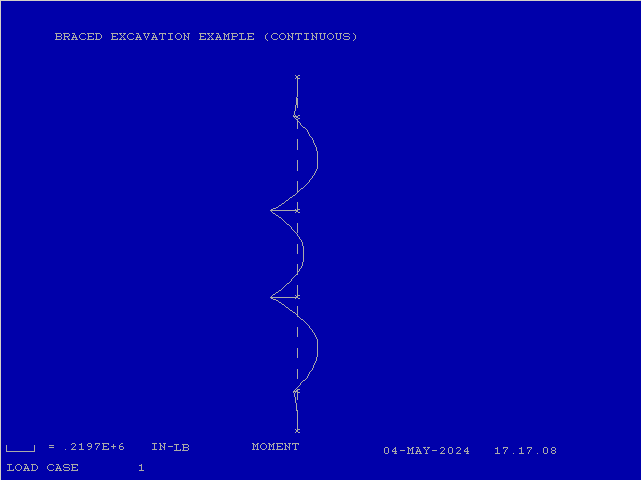
Now we look at the maximum shears and moments.
| Maxima | ||
| Analysis Method | Shear, lb/ft | Moment, ft-lb/ft |
| CFRAME, Hinged Method | 8233 | 22825 |
| SPW 911 | 8199 | 22947 |
| CFRAME, Continuous Method | 9759 | 18308 |
As was the case with the brace/strut loads, CFRAME hinged method and SPW 911 are very close. The continuous method has a higher maximum shear load but a lower maximum moment, which means that using the continuous method would probably result in using lighter sheeting.
It is worth noting that the US Steel Sheet Piling Design Manual states the following:
The steel sheet piling may be designed either as a continuous beam supported at the strut levels or by assuming pins exist at each strut thereby making each span statically determinant. It is also customary to assume a support at the bottom of the excavation.
In terms of raw conservatism, the two methods (hinged and continuous) are different. The hinged method resulted in a lower maximum strut load but the continuous method resulted in a lower sheeting moment. This may not hold for all cases; the relationship between the two may vary with differences in the number and spacing of struts and different soil loading profiles.

4 thoughts on “A Simple Example of Braced Cut Analysis”