

It’s been a while since the last post on this subject; this has slowed things down. But in the course of getting started again a little “side trip” shows a good illustration of how sometimes determining the engineering properties of a structural element–in this case a driven concrete pile–can be challenging.
The test case for this is the FHWA’s A Laboratory and Field Study of Composite Piles for Bridge Substructures. All of the information in this piece comes from that report. The report dates back to 2006 and the actual field work earlier in the decade. One of the test cases involves a bridge replacement in Hampton, VA, as shown above.
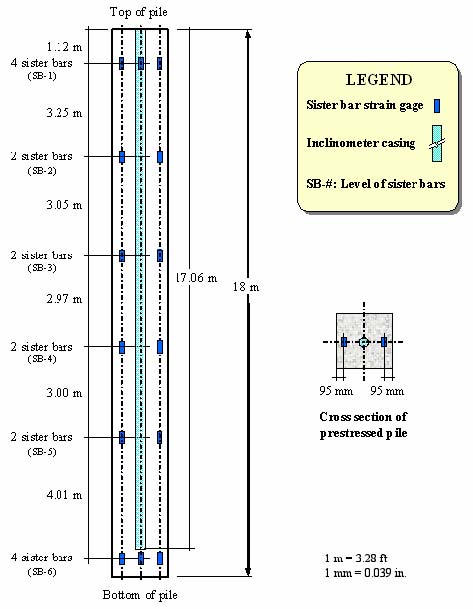
The study involved the installation and testing of three different types of piles, as shown below. We’ll concentrate on the prestressed concrete pile on the left.

The prestressed concrete pile was a 610 mm square solid pile. This means that the cross-sectional area is 
Stress-strain curves were developed for the three materials, and these are shown below.
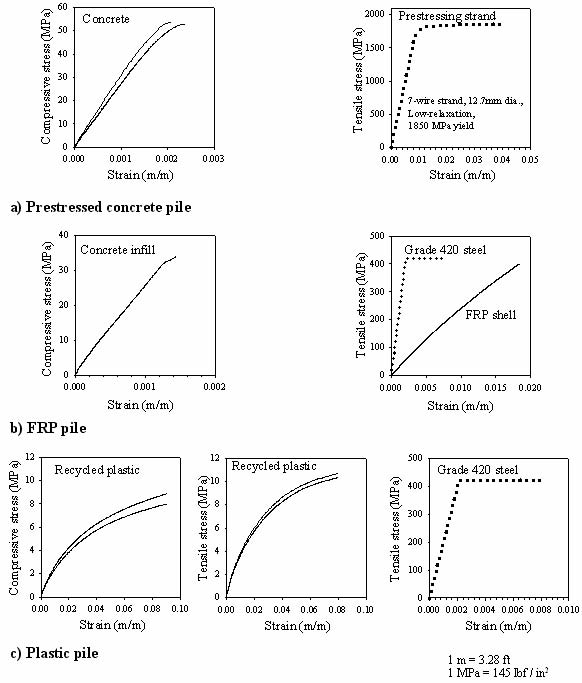
From the stress-strain curve for the concrete alone (and we usually assume that the concrete governs the pile elastic properties for compression at least) the curve would indicate that the modulus of elasticity is somewhere around 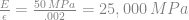


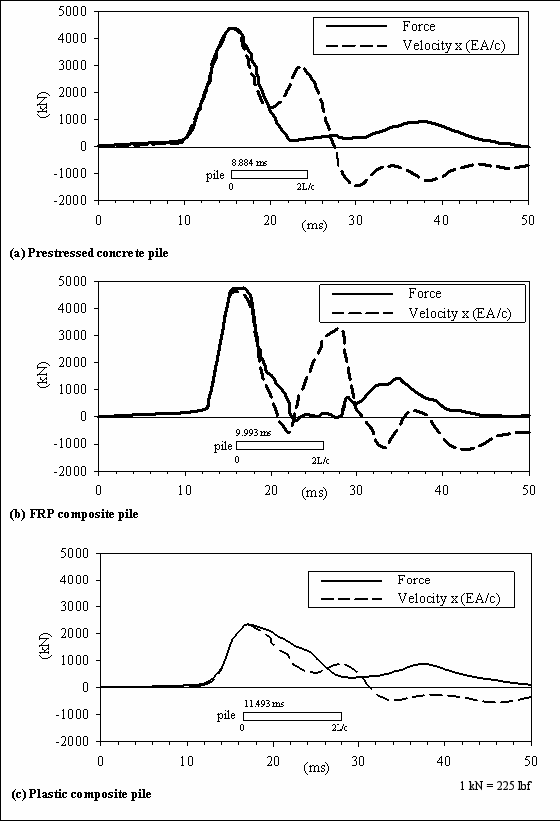
The interest from the STADYN standpoint is to obtain a force-time and velocity-time curve from the Pile Driving Analyzer, and this is certainly forthcoming:
The value of 
As is typical with PDA output, the force and the velocity (multiplied by the impedance) are plotted together. Unfortunately the document does not give the impedance for this case, so it’s necessary to back compute the impedance. Since we have a reasonably good idea of 

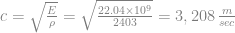
we can determine the impedance. Solving for c from

We need to pause at this point and note that other values of acoustic speed are implied in the data. For example, the following table states an acoustic or wave speed of 3800 m/sec.
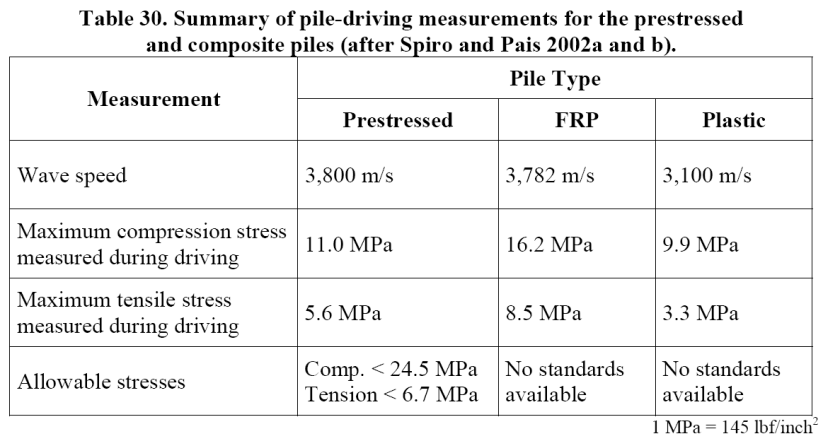
Before and after the test, PIT (Pile Integrity Tests) were run on the pile. The results are below.

Converted to SI units, the acoustic or wave speed becomes 4037 m/sec, which is fairly close to the PDA tests. The PDA results will be used for the remainder of this piece.
In any case, using the EA values from the earliest part of the test, the impedance is

The data was extracted from the PDA results. The force values could be used “as is.” The velocities were in reality the product of the velocity and the impedance, so the dashed line values were divided by the impedance just obtained to yield a velocity. Unfortunately, when this was put into STADYN, the velocities that resulted–even in the early stages of impact, where semi-infinite pile conditions predominate–the velocities of the program varied from the velocities extracted from the data by a factor of two. Checks in the program did not show any change in the way the program executed the algorithm from earlier runs, but the impedance values the program was yielding were considerably different from the one above.
In an attempt to sort things out, it is good to start by noting that the acoustic speed is computed by the equation

The report states that the pile was poured to normal Virginia DOT specifications. A fair assumption is that the density or unit weight of the concrete is close to normal, or 
Something is clearly wrong here, and the most probable culprit is the modulus of elasticity of the concrete. A common way to estimate the modulus of elasticity of concrete in MPa is to use the formula

where 

This is considerably higher than the earlier data would indicate. It’s worth noting the the specifications for the pile set a minimum value for
Another–and given the data probably a stronger–approach to compute the value of Young’s Modulus is to back compute it from the acoustic speed (which is known within reasonable values) and the density (see assumption above.) Solving the basic equation for acoustic speed for Young’s Modulus yields

Substituting our values yields

The impedance from this would be

Applying values along this line and recomputing the velocities, the results of the STADYN program and the actual PDA results were much closer.
Conclusions
- The reason for the discrepancy in Young’s Modulus–and thus the pile impedance–is unclear. It may be due to rate effects on the elastic response to concrete, or it may be due to other factors.
- Wave equation analysis are typically run according to “standard” material properties. Those who run these should be aware that, with concrete and wood, those properties may not reflect the properties of what actually gets driven into the ground.
- Any force- and velocity-time data such as are produced by the PDA should have their axes labelled properly (with both force and velocity) or with the impedance reported.
- Even with controlled research projects, discrepancies can arise in the data which can impede (pun somewhat intentional) the use of the data, and careful analysis is necessary to avoid problems such as was seen in this situation.

2 thoughts on “STADYN Wave Equation Program 12: A Case Study in the Modulus of Elasticity of Concrete Piles”