
In the last post we discussed the change in cohesion in the 
In the original study there are three test cases, as noted here. For this stage the first and the third will be considered. The results for the second (after adjustments for changes in the
That leaves the first and third. For the first–comparison with a static load test–it was necessary to readjust the values for 
| Layer | Bottom y-coordinate, m |  |
|
| 1 | 5.18 | -1 | 0 |
| 2 | 7.32 | -1 | 0 |
| 3 | 15.2 | 0.5 | 0 |
| 4 | 30.5 | 0.5 | 0 |
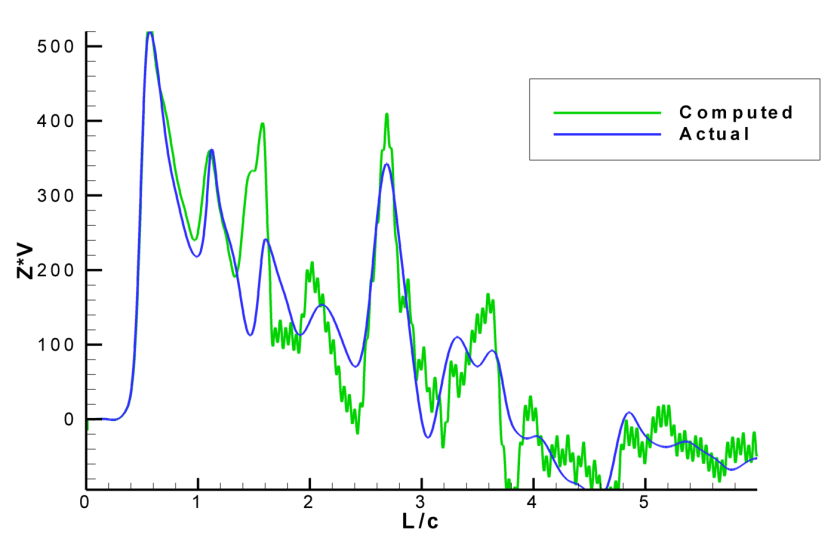
The static load test results can be seen below.

Comparison with the original study show little improvement in the failure load correlation; however, the load-deflection relationship before failure is significantly improved. The system was much softer in the original study and the improvement reflects the better estimate of the elastic modulus. The blow count is very similar to the original study.
Turning to the inverse case that was also discussed in Warrington and Newman (2018), based on the previous results, it was decided to drop consideration of 1-norm results. The results are reproduced in outline below for the three cases run (refer to Warrington and Newman (2018) for details.)
| Limiting |
Difference Sum | Static Load, kN | Average Shaft |
Average Shaft |
Toe |
Toe |
| +-1 | 0.0034 | 673 | 0.084395 | -0.46825 | -0.992 | 0.758 |
| +-2 | 0.00327 | 449 | -0.455 | -1.3375 | -0.57 | -0.727 |
| +-3 | 0.00143 | 269 | -0.26775 | -2.1775 | 0.113 | 1.12 |
Comments:
- The difference sum for the highest
- The static load decreases with broader
- The plot above does not reflect that, on the whole, the variation of
- The +- 3 run was very heavily “toe weighted” in resistance.
While both of these cases show progress, the time has come to consider the whole issue of pile-soil interface issues, which will be considered in our next updates.

One thought on “STADYN Wave Equation Program 7: Revision of Soil Properties (Results)”