
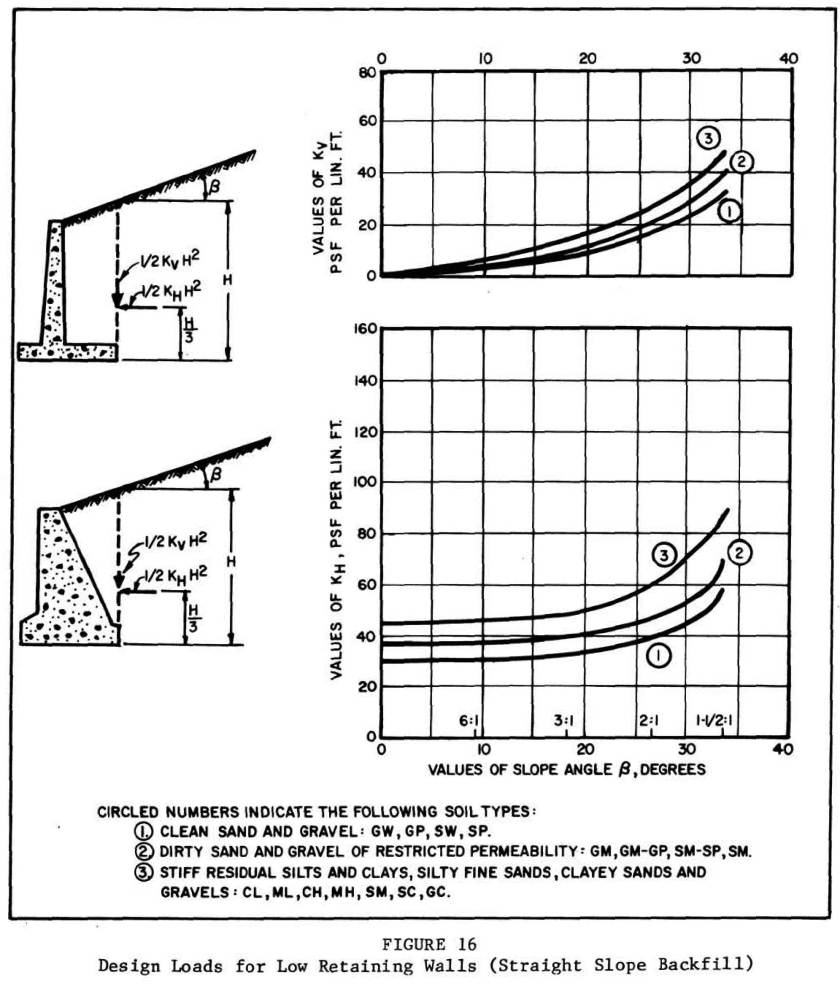
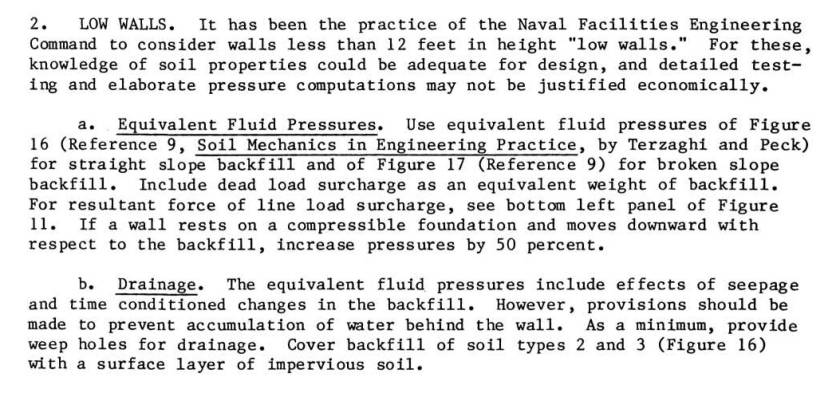
Practitioners who design gravity retaining walls are familiar with the existence of Terzaghi’s “low walls” curves to estimate the equivalent fluid pressure on the wall, horizontal and vertical. The basic chart comes in several versions but the one (for straight backfill) from NAVFAC DM 7.02 is above. The explanation for it (important when one is using it) is below.
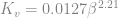
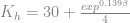
In the “slide rule” days, reading charts like this was routine. A better way now, with spreadsheets abounding, is to have a formula available. Some least squares curve fitting correlations are shown below. The variable 


- Soil 1
- Soil 2
- Soil 3
- Soil 1
- Soil 1
- Soil 2
- Soil 3
- Soil 1


3 thoughts on “Terzaghi “Low Walls” Curve Correlations”